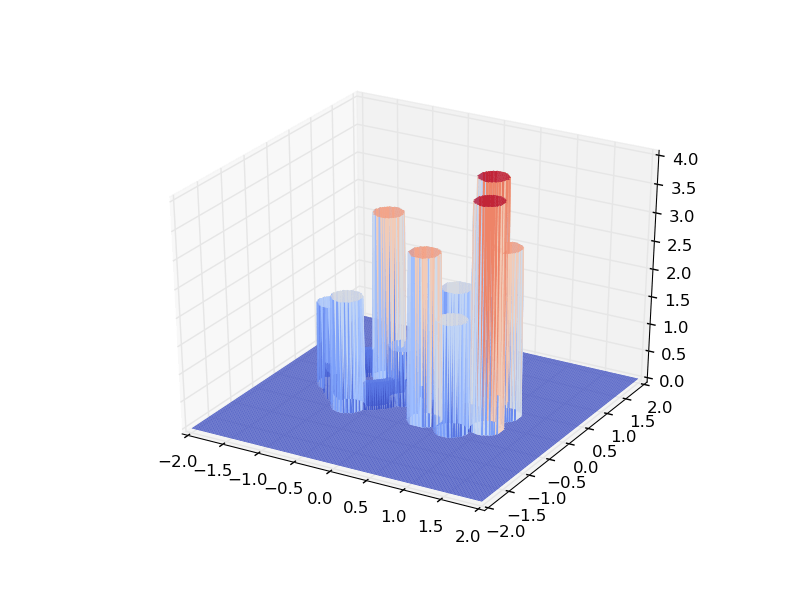
Построение круговых 3d баров (дисков) с помощью matplotlib
Я пытаюсь сделать графическую визуализацию реакционных барьеров в циклической реакции (ср. Цикл лимонной кислоты).
У меня есть барьеры для двух путей реакции, замыкающих один и тот же цикл реакции разными путями. Простой 2D-график становится не интуитивно понятным для этого варианта использования, поэтому я сделал снимок объекту Axes3D в matplotlib:
#!/usr/bin/env python
# -*- coding: utf-8 -*-

from __future__ import (absolute_import, division,
                        print_function, unicode_literals)

from math import sin, cos

import numpy as np

from mpl_toolkits.mplot3d import axes3d
import matplotlib.pyplot as plt
from matplotlib import cm


def z_cycle(mesh, origin, cycle, r, angle_offset, ring_width=0.5):
    disc_radius = r/(len(cycle)+1)
    angles = np.linspace(0, 2*np.pi, len(cycle), endpoint=False)+angle_offset
    mesh_x, mesh_y = mesh
    xo, yo = origin
    z = np.zeros_like(mesh_x)
    for a, d in zip(angles, cycle):
        xc, yc = xo + r/2*cos(a), yo + r/2*sin(a)
        z += d*((mesh_x-xc)**2 + (mesh_y-yc)**2 < (0.2*r)**2)
    z0_mask = np.where(z == 0)
    ring = np.logical_and(
        (mesh_x-xo)**2+(mesh_y-yo)**2 < (r/2+ring_width/2*disc_radius)**2,
        (mesh_x-xo)**2+(mesh_y-yo)**2 > (r/2-ring_width/2*disc_radius)**2
    )
    z += min(cycle)/2*ring*(z == 0)
    return z


def main(data='1,3,2,4,3,4,2;1,3,1.5,2', r=1.0):
    """
    Plot energy barriers for reaction cycles in 3d

    Cycles as separated by semicolon, and individual
    barrier heights are separated by comma. Cycles need
    to share the value of their respective first barrier height.
    """

    max_barrier = None
    cycles = []
    max_ = lambda a, b: max(a, b) if b is not None else a
    for cycle_string in data.split(';'):
        cycle = []
        for barrier in map(float, cycle_string.split(',')):
            max_barrier = max_(barrier, max_barrier)
            cycle.append(barrier)
        cycles.append(cycle)

    assert all(cycle[0] == cycles[0][0] for cycle in cycles[1:])

    grid1d = np.linspace(-2*r, 2*r, 200)
    mesh_x, mesh_y = mesh = np.meshgrid(grid1d, grid1d)
    mesh_z = np.zeros_like(mesh_x)

    angles = np.linspace(0, 2*np.pi, len(cycles), endpoint=False)
    for angle, cycle in zip(angles, cycles):
        # cycle is an iterable of numerical values corresponding to
        # barrier heights
        disc_radius = r/(len(cycle)+1)
        centre = ((r/2+disc_radius)*cos(angle), (r/2+disc_radius)*sin(angle))
        mesh_z += z_cycle(mesh, centre, cycle, r, np.pi+angle)

    # Plot
    fig = plt.figure()
    ax = fig.gca(projection='3d')
    ax.plot_surface(mesh_x, mesh_y, mesh_z, rstride=1, cstride=1,
                    cmap=cm.coolwarm, linewidths=0)

    plt.savefig('barriers3d.png')
    plt.show()

if __name__ == '__main__':
    main()
что дает мне:

Проблемы с этим методом включают в себя:
- Низкая производительность из-за необходимости очень плотной сетки (вращение становится замедленным)
- Графические артефакты
Кто-нибудь знает хорошее решение этих проблем?
Я пытался вручную генерировать поверхности, используя mpl_toolkits.mplot3d.art3d.Poly3DCollection но это только редко документировано.