Построить точку EER на кривой DET, используя пакет bob python
Образец кода:
>>> from matplotlib import pyplot
>>> import bob.measure
>>> positives = np.random.normal(1,1,100)
>>> negatives = np.random.normal(-1,1,100)
>>> # we assume you have your negatives and positives already split
>>> npoints = 100
>>> bob.measure.plot.det(negatives, positives, npoints, color=(0,0,0), linestyle='-', label='test')
>>> bob.measure.plot.det_axis([0.01, 40, 0.01, 40])
>>> pyplot.xlabel('FAR (%)')
>>> pyplot.ylabel('FRR (%)')
>>> pyplot.grid(True)
>>> pyplot.show()
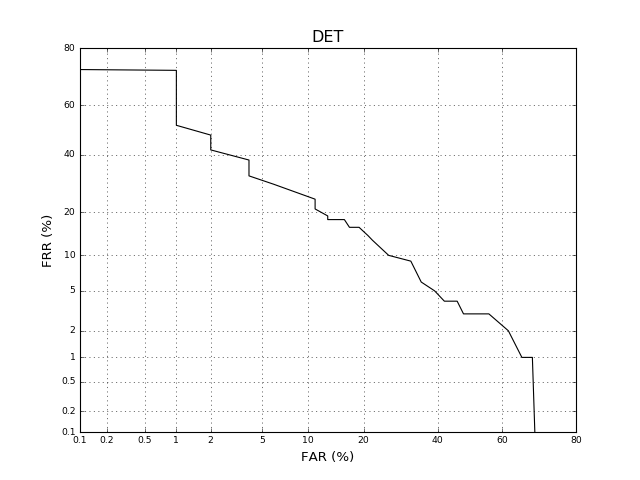
Этот код возвращает следующее изображение:
Следующие функции рассчитывают EER:
eer1 = bob.measure.eer_rocch(negatives, positives)
Я хотел бы включить эту точку пересечения в кривую. Я пытался с:
>>> from matplotlib import pyplot
>>> import bob.measure
>>> positives = np.random.normal(1,1,100)
>>> negatives = np.random.normal(-1,1,100)
>>> # we assume you have your negatives and positives already split
>>> npoints = 100
>>> bob.measure.plot.det(negatives, positives, npoints, color=(0,0,0), linestyle='-', label='test')
>>> bob.measure.plot.det_axis([0.01, 40, 0.01, 40])
>>> pyplot.plot(eer1,eer1)
>>> pyplot.xlabel('FAR (%)')
>>> pyplot.ylabel('FRR (%)')
>>> pyplot.grid(True)
>>> pyplot.show()
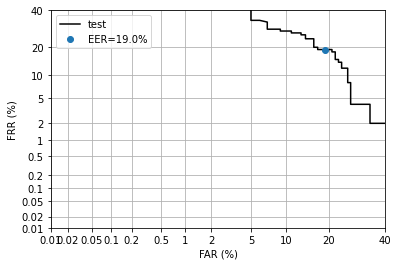
Без успеха. Я хотел бы получить фигуру, как в следующем примере: 
1 ответ
Это было исправлено в https://gitlab.idiap.ch/bob/bob.measure/-/merge_requests/95 и включено в новые версии bob.measure. Чтобы точка попадала на график, значительно увеличьте количество точек.
      from matplotlib import pyplot
import bob.measure
import numpy as np
npoints = 1000 # use a large number here
positives = np.random.normal(1,1,100)
negatives = np.random.normal(-1,1,100)
bob.measure.plot.det(negatives, positives, npoints, color=(0,0,0), linestyle='-', label='test')
bob.measure.plot.det_axis([0.01, 40, 0.01, 40])
eer1 = bob.measure.eer(negatives, positives)
# DET plots are in log scale, use ppndf to convert the point
eer2 = bob.measure.ppndf(eer1)
pyplot.plot(eer2, eer2, "o", label=f"EER={eer1*100}%")
pyplot.xlabel('FAR (%)')
pyplot.ylabel('FRR (%)')
pyplot.grid(True)
pyplot.legend()
pyplot.show()
