Log10 ось X сверху и ось Y geom_line
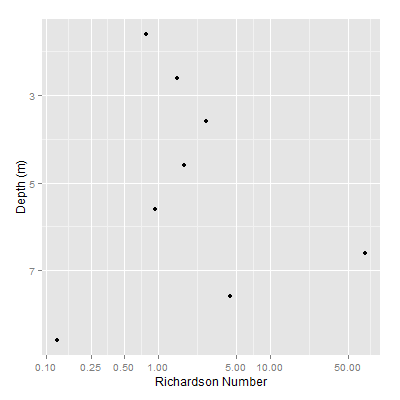
Я создал график в ggplot2, который выглядит так:
depth = c(1.6,2.6,3.6, 4.6,5.6,6.6,7.6,8.6)
ri <- c(0.790143779,1.485888068,2.682375391,1.728120227,0.948414515,71.43308158,4.416120653,0.125458801)
df = data.frame(depth,ri)

library(ggplot2)

m <- qplot(ri, depth, data=df)
m +
scale_x_log10("Richardson Number",breaks = c(0.1,0.25,0.5,1,5,10, 50)) +
scale_y_reverse("Depth (m)")
Это вывод:

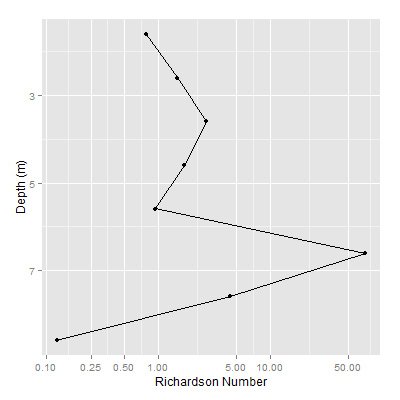
То, что я пытаюсь сделать, это иметь ось X вдоль вершины, а также включить geom_line, как тот, который я добавил здесь (вручную в Paint).

Я понимаю, что трудно заставить ggplot2 перемещать оси, и я попытался воспроизвести этот график в ggvis, но я не могу получить нужный мне масштаб log10. Могу ли я использовать R для создания графика, к которому я стремлюсь?
1 ответ
Обновленное решение
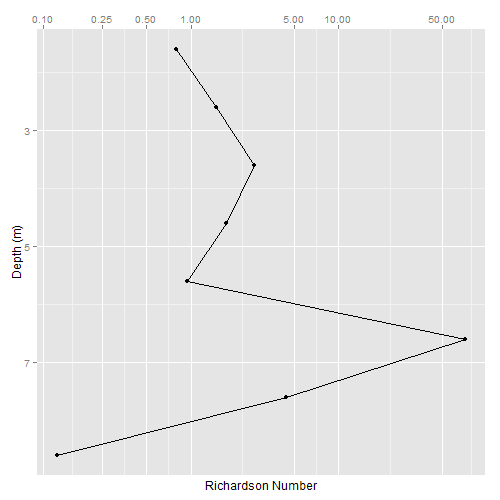
Начиная с ggplot 2.2.0, оси могут быть нарисованы в верхней части панели (и / или справа от панели)
library(ggplot2)

depth = c(1.6,2.6,3.6, 4.6,5.6,6.6,7.6,8.6)
ri <- c(0.790143779,1.485888068,2.682375391,1.728120227,0.948414515,71.43308158,4.416120653,0.125458801)
df = data.frame(depth,ri)

m <- qplot(ri, depth, data=df) +
   scale_x_log10("Richardson Number",breaks = c(0.1,0.25,0.5,1,5,10, 50),
         position = "top") +
   scale_y_reverse("Depth (m)")+
   geom_path()
Оригинальное решение Оригинал, после небольшого обновления до версии ggplot 2.2.0.
Оси можно перемещать, используя gtable функции. Адаптируя код из ответа @ Уолтера здесь, основная идея заключается в следующем: получить ось (текст оси и метки); поменять местами текст оси и отметки; добавить новую строку в макет gtable сразу над панелью графика; вставьте измененную ось в новую строку.
library(ggplot2)
library(gtable)
library(grid)


depth = c(1.6,2.6,3.6, 4.6,5.6,6.6,7.6,8.6)
ri <- c(0.790143779,1.485888068,2.682375391,1.728120227,0.948414515,71.43308158,4.416120653,0.125458801)
df = data.frame(depth,ri)

m <- qplot(ri, depth, data=df) +
  scale_x_log10("Richardson Number",breaks = c(0.1,0.25,0.5,1,5,10, 50)) +
  scale_y_reverse("Depth (m)")+
  geom_path()


# Get ggplot grob
g1 <- ggplotGrob(m)

## Get the position of the plot panel in g1
pp <- c(subset(g1$layout, name == "panel", se = t:r))

# Title grobs have margins.
# The margins need to be swapped.
# Function to swap margins -
# taken from the cowplot package:
# https://github.com/wilkelab/cowplot/blob/master/R/switch_axis.R
vinvert_title_grob <- function(grob) {
  heights <- grob$heights
  grob$heights[1] <- heights[3]
  grob$heights[3] <- heights[1]
  grob$vp[[1]]$layout$heights[1] <- heights[3]
  grob$vp[[1]]$layout$heights[3] <- heights[1]

  grob$children[[1]]$hjust <- 1 - grob$children[[1]]$hjust
  grob$children[[1]]$vjust <- 1 - grob$children[[1]]$vjust
  grob$children[[1]]$y <- unit(1, "npc") - grob$children[[1]]$y
  grob
}

# Get  xlab  and swap margins
index <- which(g1$layout$name == "xlab-b")
xlab <- g1$grobs[[index]]
xlab <- vinvert_title_grob(xlab)

# Put xlab at the top of g1
g1 <- gtable_add_rows(g1, g1$heights[g1$layout[index, ]$t], pp$t-1)
g1 <- gtable_add_grob(g1, xlab, pp$t, pp$l, pp$t, pp$r, clip = "off", name="topxlab")

# Get x axis (axis line, tick marks and tick mark labels)
index <- which(g1$layout$name == "axis-b")
xaxis <- g1$grobs[[index]]

# Swap axis ticks and tick mark labels
ticks <- xaxis$children[[2]]
ticks$heights <- rev(ticks$heights)
ticks$grobs <- rev(ticks$grobs)

# Move tick marks
  #  Get tick mark length
  plot_theme <- function(p) {
    plyr::defaults(p$theme, theme_get())
  }
  tml <- plot_theme(m)$axis.ticks.length   # Tick mark length

ticks$grobs[[2]]$y <- ticks$grobs[[2]]$y - unit(1, "npc") + tml

# Swap tick mark labels' margins and justifications
ticks$grobs[[1]] <- vinvert_title_grob(ticks$grobs[[1]])

# Put ticks and tick mark labels back into xaxis
xaxis$children[[2]] <- ticks

# Add axis to top of g1
g1 <- gtable_add_rows(g1, g1$heights[g1$layout[index, ]$t], pp$t)
g1 <- gtable_add_grob(g1, xaxis, pp$t+1, pp$l, pp$t+1, pp$r, clip = "off", name = "axis-t")

# Remove original x axis and xlab
g1 = g1[-c(9,10), ]

# Draw it
grid.newpage()
grid.draw(g1)
