Построить 2D массив (x,y,z) точек в 3D пространстве (Matplotlib)
Я новичок в Python и особенно в Matplotlib. У меня есть массив 22797x3, построенный из умножения между двумя другими массивами, один длиной 22797x400, а другой длиной 400x3. В полученном массиве (22797x3) каждая строка представляет точку с координатами (x,y,z), следовательно, 3 столбца. Как я могу построить полученный массив на трехмерной поверхности, где я вижу все 22797 точек, распределенных в трехмерном пространстве? Эти данные предназначены для будущей кластеризации Kmeans, поэтому мне нужно их визуализировать.
Пока что я пробовал:
import numpy as np
from matplotlib import pyplot as plt
from mpl_toolkits.mplot3d import Axes3D

#building the 22797x3 array:


#loading the first array from .txt file, 22797x400 long.
array = np.loadtxt('C:\Users\Scripts/final_array.txt', usecols=range(400))
array = np.float32(array)

#loading the second array from .txt file, 400x3 long.
small_vh2 = np.loadtxt('C:\Users\Scripts/small_vh2.txt', usecols=range(3))
small_vh2 = np.float32(small_vh2)

#multiplying and getting result array 22797x3 long:

Y = np.array(np.matmul(array,small_vh2))
#I've checked Y dimensions, it's 22797x3 long, working fine.

#now I must plot it in 3D:
fig = plt.figure()

ax = Axes3D(fig)
ax.scatter(Y[:, 0], Y[:, 1], Y[:, 2])

plt.show()
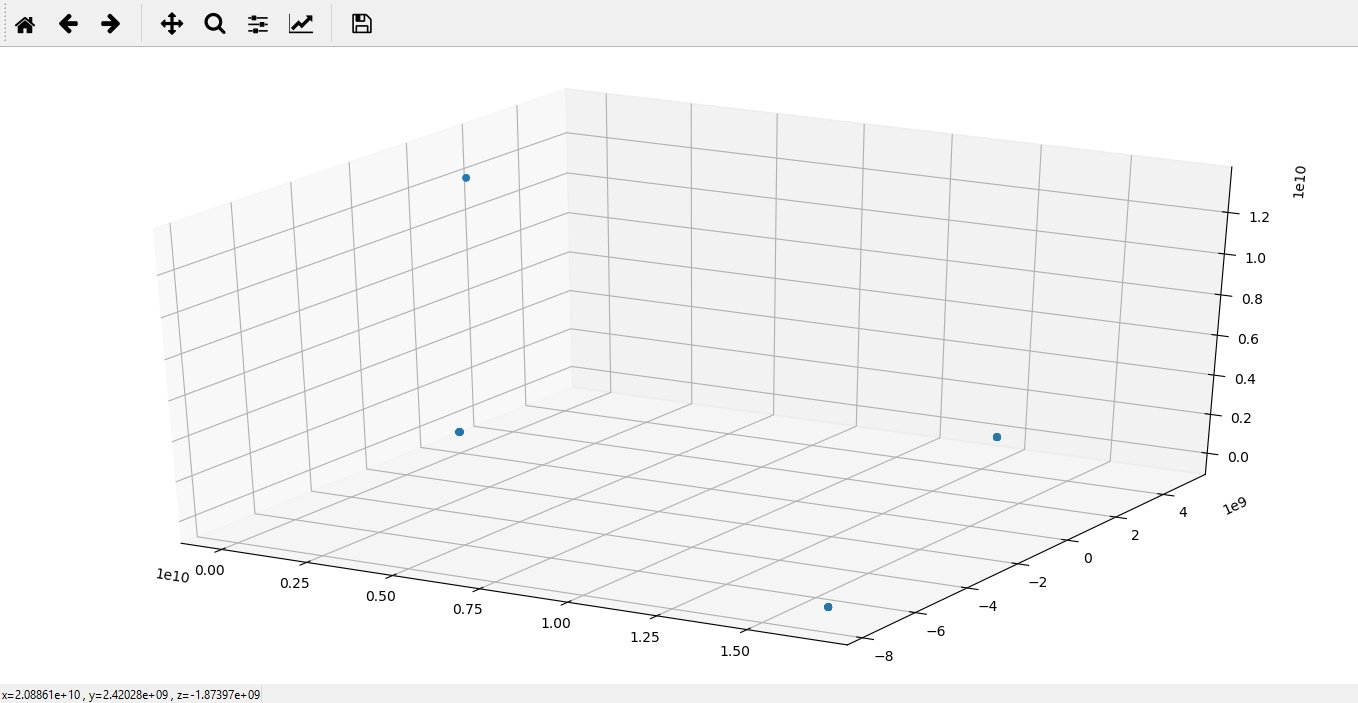
Я продолжаю получать результат, показанный на картинке ниже:
Мне нужно набрать 22797 очков, и я продолжаю получать только 4 очка. Кто-нибудь знает, что не так с кодом?
1 ответ
Решение
from mpl_toolkits.mplot3d import Axes3D
import numpy as np
from matplotlib import pyplot as plt

# made 2 random arrays of the same size as yours
array = np.random.rand(22797, 400)
small_vh2 = np.random.rand(400,3)
Y = np.matmul(array,small_vh2)

#now I must plot it in 3D:
fig = plt.figure()
ax = fig.add_subplot(111, projection='3d')

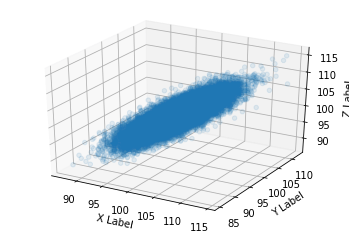
ax.scatter(Y[:, 0], Y[:, 1], Y[:, 2], alpha = 0.1)
ax.set_xlabel('X Label')
ax.set_ylabel('Y Label')
ax.set_zlabel('Z Label')

plt.show()

