Центрирование заголовка на примере галереи Matplotlib
У меня есть следующий код, скопированный из галереи
import numpy as np
import matplotlib.pyplot as plt
from matplotlib.ticker import NullFormatter
from itertools import groupby
import matplotlib.pyplot as plt
import numpy
#fig = plt.figure(figsize=(13, 12))

files = ("file1","file2")
place = (1,2)
print files
print place
plt.bone()
for f in zip(files,place):
    print "file", f
    # would like the two below each other, don't know how, so i clear
    plt.clf()
    # data comes from the files normally
    x = np.random.randn(1000)
    y = np.random.randn(1000)
    z = np.random.randn(100)

    nullfmt   = NullFormatter()         # no labels

    # definitions for the axes
    left, width = 0.1, 0.65
    bottom, height = 0.1, 0.65
    bottom_h = left_h = left+width+0.02

    rect_scatter = [left, bottom, width, height]
    rect_histx = [left, bottom_h, width, 0.2]
    rect_histy = [left_h, bottom, 0.2, height]

    # start with a rectangular Figure
    plt.figure(1, figsize=(8,8))
    plt.xlabel('$^{13}$C (ppm)')
    plt.ylabel('$^{15}$H (ppm)')


    axScatter = plt.axes(rect_scatter)
    axHistx = plt.axes(rect_histx)
    axHisty = plt.axes(rect_histy)

    # no labelsfor the histgrams
    axHistx.xaxis.set_major_formatter(nullfmt)
    axHisty.yaxis.set_major_formatter(nullfmt)

    # the scatter plot:
    #axScatter.scatter(x, y)
    axScatter.scatter(numpy.float64(x),numpy.float64(y), c=numpy.float64(z),lw=0.1,s=5)

    # now determine nice limits by hand:
    binwidth = 0.25
    xymax = np.max( [np.max(np.fabs(x)), np.max(np.fabs(y))] )
    lim = ( int(xymax/binwidth) + 1) * binwidth

    axScatter.set_xlim( (min(x), max(x)+binwidth) )
    axScatter.set_ylim( (min(y), max(y)+binwidth) )
    #axScatter.set_ylim( (-lim, lim) )
    binwidth = (max(x) - min(x))/20
    bins = np.arange(min(x), max(x) + binwidth, binwidth)
    axHistx.hist(x, bins=bins)
    binwidth = (max(y) - min(y))/20
    bins = np.arange(min(y), max(y) + binwidth, binwidth)
    axHisty.hist(y, bins=bins, orientation='horizontal')

    axHistx.set_xlim( axScatter.get_xlim() )
    axHisty.set_ylim( axScatter.get_ylim() )
    plt.savefig(f[0]+"out_hist.png", format='png',dpi=1200)
    plt.savefig(f[0]+"out_hist.svg", format='svg')
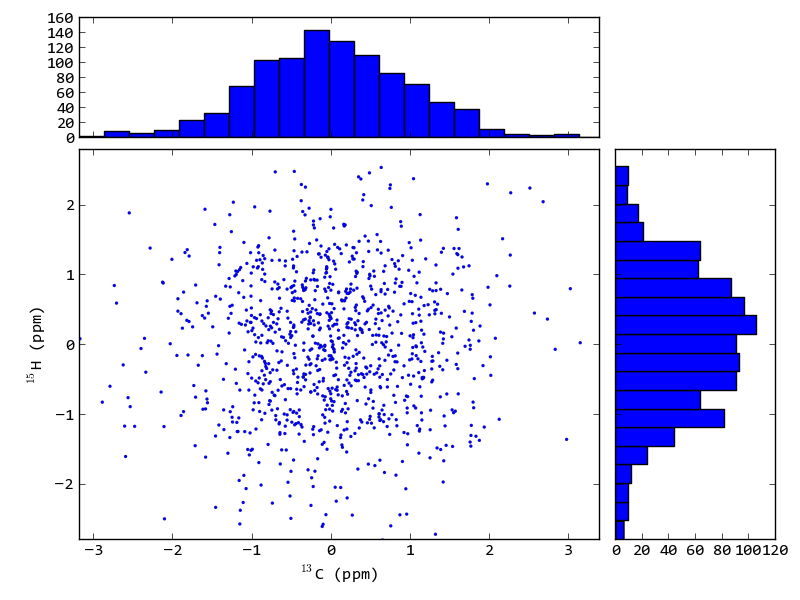
Этот код дает мне:
Однако я не знаю, откуда этот кадр на заднем плане. А также я хотел бы, чтобы мои подписи были сосредоточены на сюжете, а не на всем. Наконец, я не мог на всю жизнь получить эти графики друг над другом в простом JPG. Как мне решить эти проблемы?
1 ответ
Решение
Когда вы звоните plt.xlabel()Pyplot создаст оси, это фоновые оси. удалите две строки, вызовите plt.xlabel() & plt.ylabel() и добавьте следующие строки после axScatter = plt.axes(rect_scatter)
axScatter.set_xlabel('$^{13}$C (ppm)')
axScatter.set_ylabel('$^{15}$H (ppm)')