Порядок гистограмм с накоплением различается между ggplot2 и ggiraph
Я создаю блестящее приложение, которое готовит гистограмму с накоплением и всплывающую подсказку, показывающую уровни удовлетворенности для 3 элементов и 2 типов респондентов. Вот данные, которые составляют диаграмму:
mydf <- structure(list(Resp = structure(c(1L, 1L, 2L, 1L, 2L, 1L, 1L,
2L, 1L, 2L, 1L, 1L, 2L, 1L, 2L, 1L, 1L, 2L, 1L, 2L), .Label = c("Resp_A",
"Resp_B"), class = "factor"), Rating = structure(c(4L, 4L, 4L,
4L, 4L, 3L, 3L, 3L, 3L, 3L, 2L, 2L, 2L, 2L, 2L, 1L, 1L, 1L, 1L,
1L), .Label = c("DK/NA", "Dissatisfied", "Neutral", "Satisfied"
), class = "factor"), Question = structure(c(1L, 2L, 2L, 3L,
3L, 1L, 2L, 2L, 3L, 3L, 1L, 2L, 2L, 3L, 3L, 1L, 2L, 2L, 3L, 3L
), .Label = c("q14", "q12", "q11"), class = "factor"), count = c(29,
27, 11, 25, 12, 9, 12, 3, 9, 5, 3, 2, 11, 5, 8, 4, 4, 8, 6, 8
), prop = c(0.644444444444444, 0.6, 0.333333333333333, 0.555555555555556,
0.363636363636364, 0.2, 0.266666666666667, 0.0909090909090909,
0.2, 0.151515151515152, 0.0666666666666667, 0.0444444444444444,
0.333333333333333, 0.111111111111111, 0.242424242424242, 0.0888888888888889,
0.0888888888888889, 0.242424242424242, 0.133333333333333, 0.242424242424242
), Label = structure(c(1L, 2L, 2L, 3L, 3L, 1L, 2L, 2L, 3L, 3L,
1L, 2L, 2L, 3L, 3L, 1L, 2L, 2L, 3L, 3L), .Label = c("Label_1",
"Label_2", "Label_3"), class = "factor"), tooltip = c("<b>Satisfied</b>\n<b>Question:</b> Question_Text_1\n<b>n=</b> 29\n<b>Percentage:</b> 64%",
"<b>Satisfied</b>\n<b>Question:</b> Question_Text_2\n<b>n=</b> 27\n<b>Percentage:</b> 60%",
"<b>Satisfied</b>\n<b>Question:</b> Question_Text_2\n<b>n=</b> 11\n<b>Percentage:</b> 33%",
"<b>Satisfied</b>\n<b>Question:</b> Question_Text_3\n<b>n=</b> 25\n<b>Percentage:</b> 56%",
"<b>Satisfied</b>\n<b>Question:</b> Question_Text_3\n<b>n=</b> 12\n<b>Percentage:</b> 36%",
"<b>Neutral</b>\n<b>Question:</b> Question_Text_1\n<b>n=</b> 9\n<b>Percentage:</b> 20%",
"<b>Neutral</b>\n<b>Question:</b> Question_Text_2\n<b>n=</b> 12\n<b>Percentage:</b> 27%",
"<b>Neutral</b>\n<b>Question:</b> Question_Text_2\n<b>n=</b> 3\n<b>Percentage:</b> 9%",
"<b>Neutral</b>\n<b>Question:</b> Question_Text_3\n<b>n=</b> 9\n<b>Percentage:</b> 20%",
"<b>Neutral</b>\n<b>Question:</b> Question_Text_3\n<b>n=</b> 5\n<b>Percentage:</b> 15%",
"<b>Dissatisfied</b>\n<b>Question:</b> Question_Text_1\n<b>n=</b> 3\n<b>Percentage:</b> 7%",
"<b>Dissatisfied</b>\n<b>Question:</b> Question_Text_2\n<b>n=</b> 2\n<b>Percentage:</b> 4%",
"<b>Dissatisfied</b>\n<b>Question:</b> Question_Text_2\n<b>n=</b> 11\n<b>Percentage:</b> 33%",
"<b>Dissatisfied</b>\n<b>Question:</b> Question_Text_3\n<b>n=</b> 5\n<b>Percentage:</b> 11%",
"<b>Dissatisfied</b>\n<b>Question:</b> Question_Text_3\n<b>n=</b> 8\n<b>Percentage:</b> 24%",
"<b>DK/NA</b>\n<b>Question:</b> Question_Text_1\n<b>n=</b> 4\n<b>Percentage:</b> 9%",
"<b>DK/NA</b>\n<b>Question:</b> Question_Text_2\n<b>n=</b> 4\n<b>Percentage:</b> 9%",
"<b>DK/NA</b>\n<b>Question:</b> Question_Text_2\n<b>n=</b> 8\n<b>Percentage:</b> 24%",
"<b>DK/NA</b>\n<b>Question:</b> Question_Text_3\n<b>n=</b> 6\n<b>Percentage:</b> 13%",
"<b>DK/NA</b>\n<b>Question:</b> Question_Text_3\n<b>n=</b> 8\n<b>Percentage:</b> 24%"
), Ord = c(1, 1, 1, 1, 1, 2, 2, 2, 2, 2, 3, 3, 3, 3, 3, 4, 4,
4, 4, 4), Question_Text = structure(c(3L, 1L, 1L, 2L, 2L, 3L,
1L, 1L, 2L, 2L, 3L, 1L, 1L, 2L, 2L, 3L, 1L, 1L, 2L, 2L), .Label = c("Question_Text_2",
"Question_Text_3", "Question_Text_1"), class = "factor")), row.names = c(NA,
-20L), .Names = c("Resp", "Rating", "Question", "count", "prop",
"Label", "tooltip", "Ord", "Question_Text"), class = c("tbl_df",
"tbl", "data.frame"))
Пара дополнительных битов:
#Value colours
Labels_Colours <- c("Satisfied" = "#59A14F", "Neutral" = "#76B7B2", "Dissatisfied" = "#F28E2B", "DK/NA" = "#BAB0AC")

#Tooltip feature
tooltip_css <- "background-color:white;font-style:italic;padding:10px;border-radius:10px 20px 10px 20px;"
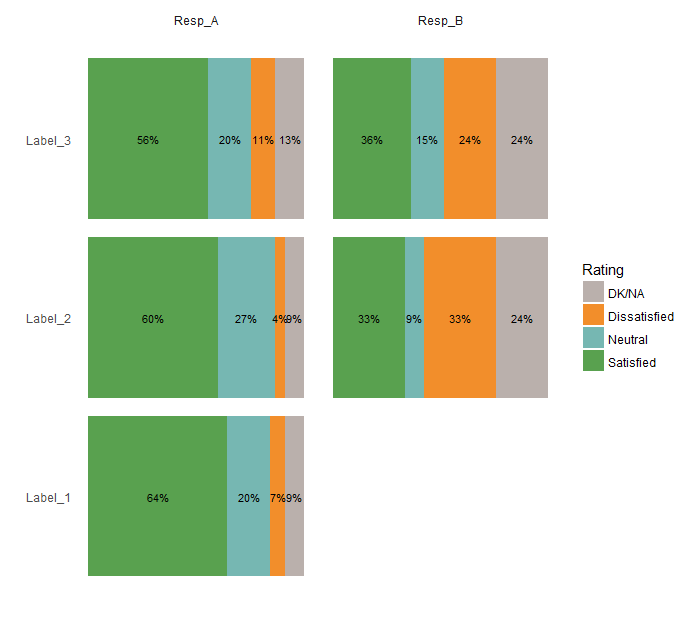
Вот что на графике ggplot2 похоже. Этот график именно то, что я хочу, чтобы мой ggiraph диаграмма должна выглядеть так:
library(ggplot2)
library(dplyr)
mydf %>% filter(prop > 0 | is.na(prop)) %>%
ggplot(aes(x = Label, y = ifelse(is.na(prop), 0, prop), fill = Rating)) +
geom_col() +
geom_text(aes(label = ifelse(is.na(prop), prop, percent(round(prop, 2)))), position = position_stack(vjust = 0.5), size = 3) +
scale_fill_manual(values = Labels_Colours) +
coord_flip() +
facet_grid(~ Resp, drop = FALSE) +
labs(x = "", y = "") +
theme_minimal() +
theme(
    axis.text.x = element_blank(),
    axis.ticks.x = element_blank(),
    panel.grid.major = element_blank(),
    panel.grid.minor = element_blank()
)
Теперь вот моя попытка конечного продукта, используя ggiraph, Единственная разница в коде здесь заключается в том, что я использую geom_bar_interactive вместо geom_colи, конечно, последняя строка:
library(ggiraph)
mychart <- mydf %>% filter(prop > 0 | is.na(prop)) %>%
ggplot(aes(x = Label, y = ifelse(is.na(prop), 0, prop), fill = Rating)) +
geom_bar_interactive(aes(tooltip = tooltip, data_id = Rating), stat = "identity") +
geom_text(aes(label = ifelse(is.na(prop), prop, percent(round(prop, 2)))), position = position_stack(vjust = 0.5), size = 3) +
scale_fill_manual(values = Labels_Colours) +
coord_flip() +
facet_grid(~ Resp, drop = FALSE) +
labs(x = "", y = "") +
theme_minimal() +
theme(
    axis.text.x = element_blank(),
    axis.ticks.x = element_blank(),
    panel.grid.major = element_blank(),
    panel.grid.minor = element_blank()
)
ggiraph(code = print(mychart), width = 1, point = 4, width_svg = 8, height_svg = 2, tooltip_extra_css = tooltip_css, hover_css = "opacity:0.5")
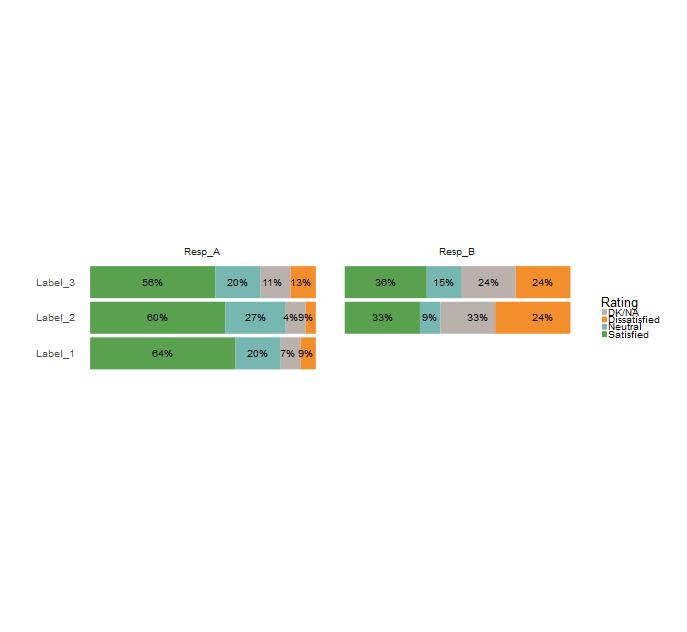
Панель "DK/NA" каким-то образом поменялась местами с панелью "Неудовлетворенный", но мои процентные метки и легенда остаются в правильных местах. Что вызывает это? Я предполагаю, что это как-то связано с порядком уровней в Rating фактор, но они, кажется, в правильном порядке. Я озадачен
2 ответа
Это о группировке. эстетика tooltip а также data_id в geom_bar_interactive (или в geom_bar, тот же эффект) сделать группировку отличной от группировки geom_text,
[ http://ggplot2.tidyverse.org/reference/aes_group_order.html] По умолчанию группа настроена на взаимодействие всех дискретных переменных на графике. Это часто правильно разделяет данные, но если это не так, или когда на графике не используется дискретная переменная, вам необходимо явно определить структуру группировки, сопоставив группу с переменной, имеющей различное значение для каждой группы.
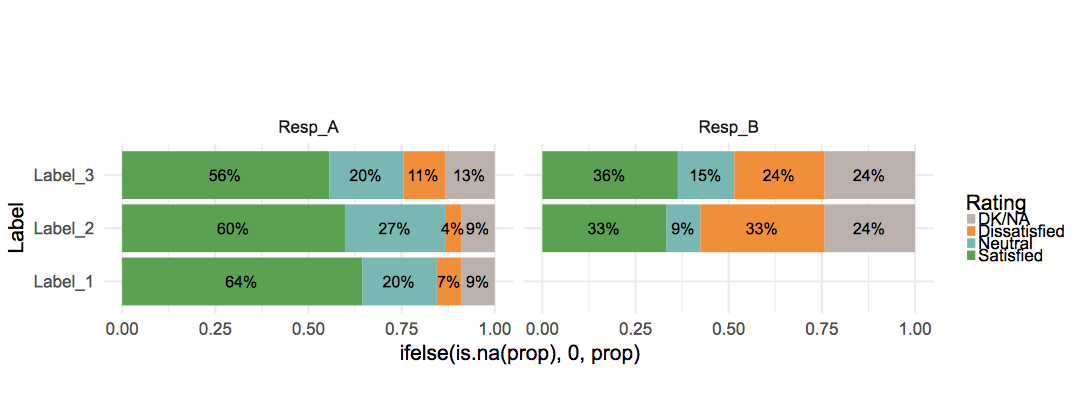
Определение эстетики группы решает проблему (в основном или в geom_bar):
mychart <- mydf %>% filter(prop > 0 | is.na(prop)) %>%
  ggplot(aes(x = Label, y = ifelse(is.na(prop), 0, prop), fill = Rating, group = Rating)) +
  geom_bar_interactive(mapping = aes(tooltip = tooltip, data_id = Rating), stat = "identity") +
  geom_text(aes(label = ifelse(is.na(prop), prop, percent(round(prop, 2)))), position = position_stack(vjust = 0.5), size = 3) +
  scale_fill_manual(values = Labels_Colours) +
  coord_flip() +
  facet_grid(~ Resp, drop = FALSE) +
  theme_minimal()
ggiraph(code = print(mychart), width = 1, point = 4, width_svg = 8, height_svg = 2, tooltip_extra_css = tooltip_css, hover_css = "opacity:0.5")
Как @DavidGohel указывает, что это ошибка, я обнаружил, что следующее действует как обходной путь:
library(forcats)
mydf <- arrange(mydf, Rating)
mydf$tooltip <- fct_inorder(mydf$tooltip)
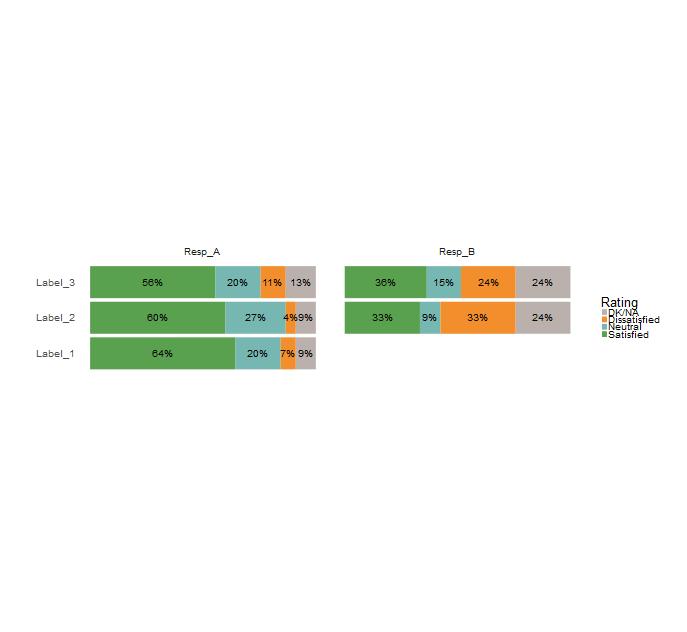
Теперь работает ggiraph код еще раз:


