Циклическая ошибка при использовании ggridges в R (joyplot)
В настоящее время я работаю с библиотекой ggridges, чтобы создать "диаграмму радости". Я написал это:
data3 %>%
  mutate(ftFct = fct_rev(as.factor(ft_newnum))) %>%
  ggplot(aes(y = ftFct)) +
  geom_density_ridges(aes(x = ft, fill = paste(ftFct, rep)),
                      alpha = .8, color = "white", from = 0, to = 100) +
  labs(x = "Feeling Themometer Responses (%)",
   y = " ",
   title = "Republican vs Democratic Views Towards...",
   subtitle = "Analysis unit: students (n = 595)") +
   scale_y_discrete(expand = c(0.01, 0)) +
   scale_x_continuous(expand = c(0.01, 0)) +
   scale_fill_cyclical(breaks = c("2 0", "2 1"),
                       labels = c(`2 0` = "Democrat", `2 1` = "Republican"),
                       values = c("#8080ff", "#ff8080", "#0000ff", "#ff0000"),
                       name = "Political Affiliation", guide = "legend") +
  theme_ridges(grid = FALSE)
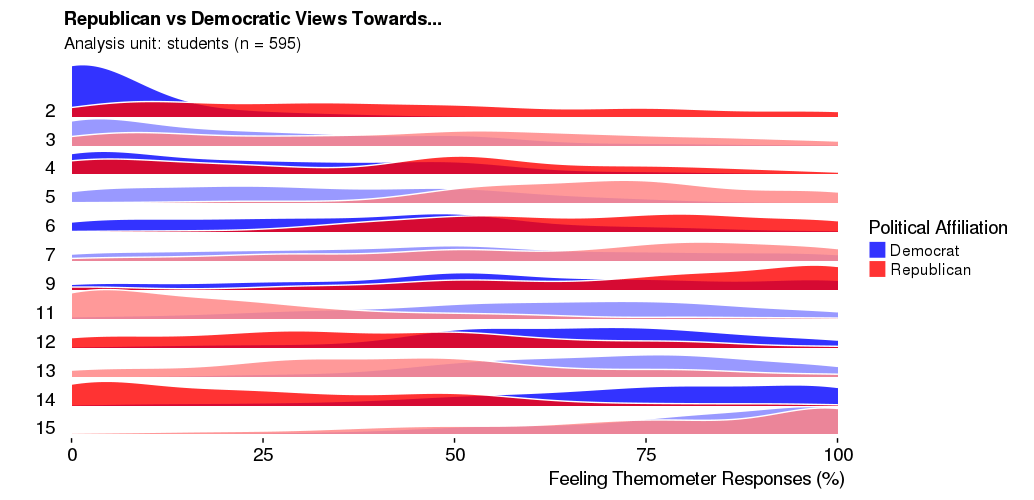
... который получает мне эту цифру:
Это именно то, что я хочу - идеальное форматирование, и каждая строка чередуется между темными и светлыми цветами, обеспечивая некоторую контрастность и повышенную читаемость.
Затем я помечаю переменную оси Y, чтобы мы знали, на что мы смотрим. Я помечаю 'ft_newnum' так:
data3$ft_newnum <- factor(data3$ft_newnum,
                       levels = c(2,3,4,5,6,7,9,11,12, 13, 14, 15),
                       labels = c("Donald Trump", "Christian fundamentalists", "Elites", 'Republicans', 'Denison Republicans', 'Denison Greeks', 'Denison Varsity Athlete','Hillary Clinton', 'Denison Democrats', 'Democrats', 'Bernie Sanders', 'Weinberg'))
Затем отредактируйте код, чтобы включить это изменение:
data3 %>%
  mutate(ftFct = fct_rev(as.factor(ft_newnum))) %>%
  ggplot(aes(y = ftFct)) +
  geom_density_ridges(aes(x = ft, fill = paste(ftFct, rep)),
                      alpha = .8, color = "white", from = 0, to = 100) +
  labs(x = "Feeling Themometer Responses (%)",
       y = " ",
       title = "Republican vs Democratic Views Towards...",
       subtitle = "Analysis unit: students (n = 595)") +
  scale_y_discrete(expand = c(0.01, 0)) +
  scale_x_continuous(expand = c(0.01, 0)) +
  scale_fill_cyclical(breaks = c("Donald Trump 0", "Donald Trump 1"),
                      labels = c(`Donald Trump 0` = "Democrat", `Donald Trump 1` = "Republican"),
                      values = c("#8080ff", "#ff8080", "#0000ff", "#ff0000"),
                      name = "Political Affiliation", guide = "legend") +
  theme_ridges(grid = FALSE)
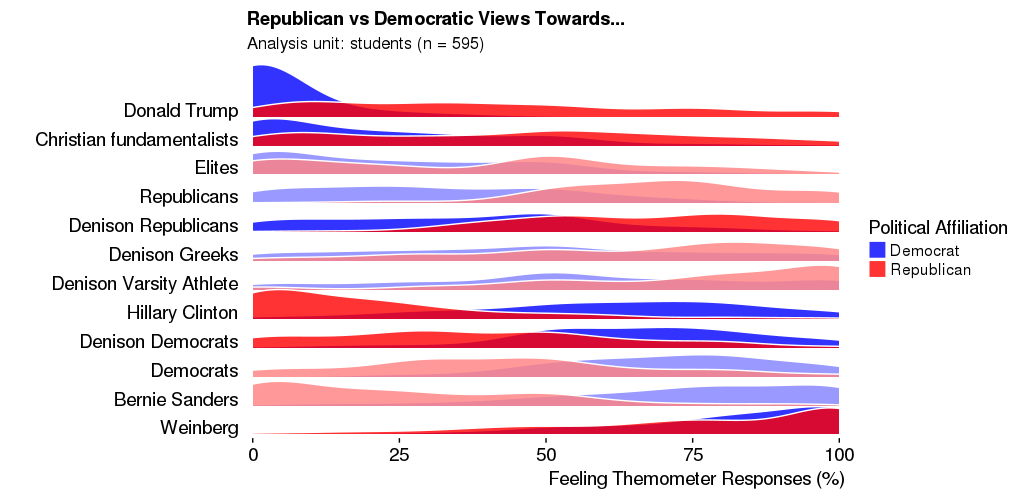
Этот код отображает эту фигуру:
Это почти идеально, но проблема в том, что чередование светлых и темных цветов отключено. Первые две линии темного цвета, а затем две светлые линии. Мне нужно сохранить метки, но также сохранить точное циклическое чередование, как показано на первом рисунке.
Есть идеи? Спасибо!
1 ответ
Ах, я понял это. Вместо перезаписи переменной 'ft_newnum' создайте новую переменную (ft_newnum2).
data3$ft_newnum2 <- factor(data3$ft_newnum,
                       levels = c(2,3,4,5,6,7,9,11,12, 13, 14, 15),
                       labels = c("Donald Trump", "Christian fundamentalists", "Elites", 'Republicans', 'Denison Republicans', 'Denison Greeks', 'Denison Varsity Athlete','Hillary Clinton', 'Denison Democrats', 'Democrats', 'Bernie Sanders', 'Weinberg'))
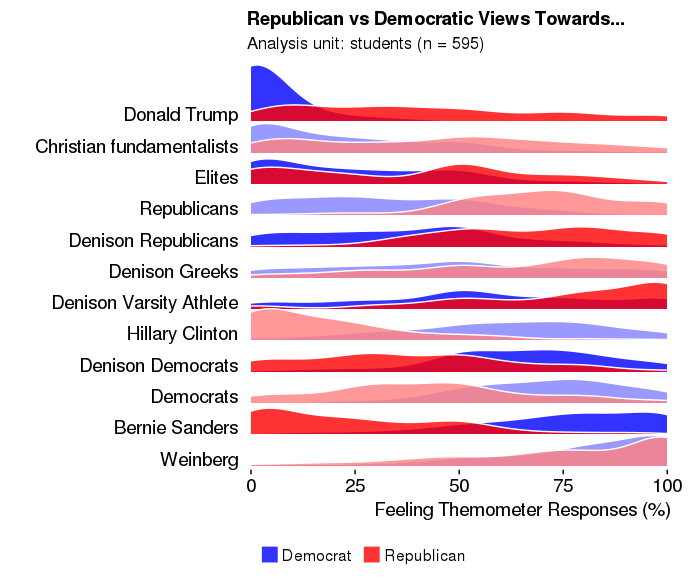
ft_num2 используется для настройки оси Y, в то время как исходный ft_num остается и используется для заполнения графика.
data3 %>%
  mutate(ftFct = fct_rev(as.factor(ft_newnum2))) %>%
  ggplot(aes(y = ftFct)) +
  geom_density_ridges(aes(x = ft, fill = paste(ft_newnum, rep)),
                      alpha = .8, color = "white", from = 0, to = 100) +
  labs(x = "Feeling Themometer Responses (%)",
       y = " ",
       title = "Republican vs Democratic Views Towards...",
       subtitle = "Analysis unit: students (n = 595)") +
  scale_y_discrete(expand = c(0.01, 0)) +
  scale_x_continuous(expand = c(0.01, 0)) +
  scale_fill_cyclical(breaks = c("2 0", "2 1"),
                      labels = c(`Donald Trump 0` = "Democrat", `Donald Trump 1` = "Republican"),
                      values = c("#8080ff", "#ff8080", "#0000ff", "#ff0000"),
                      name = "Political Affiliation", guide = "legend") +
  theme_ridges(grid = FALSE) +
  theme(legend.position="bottom")
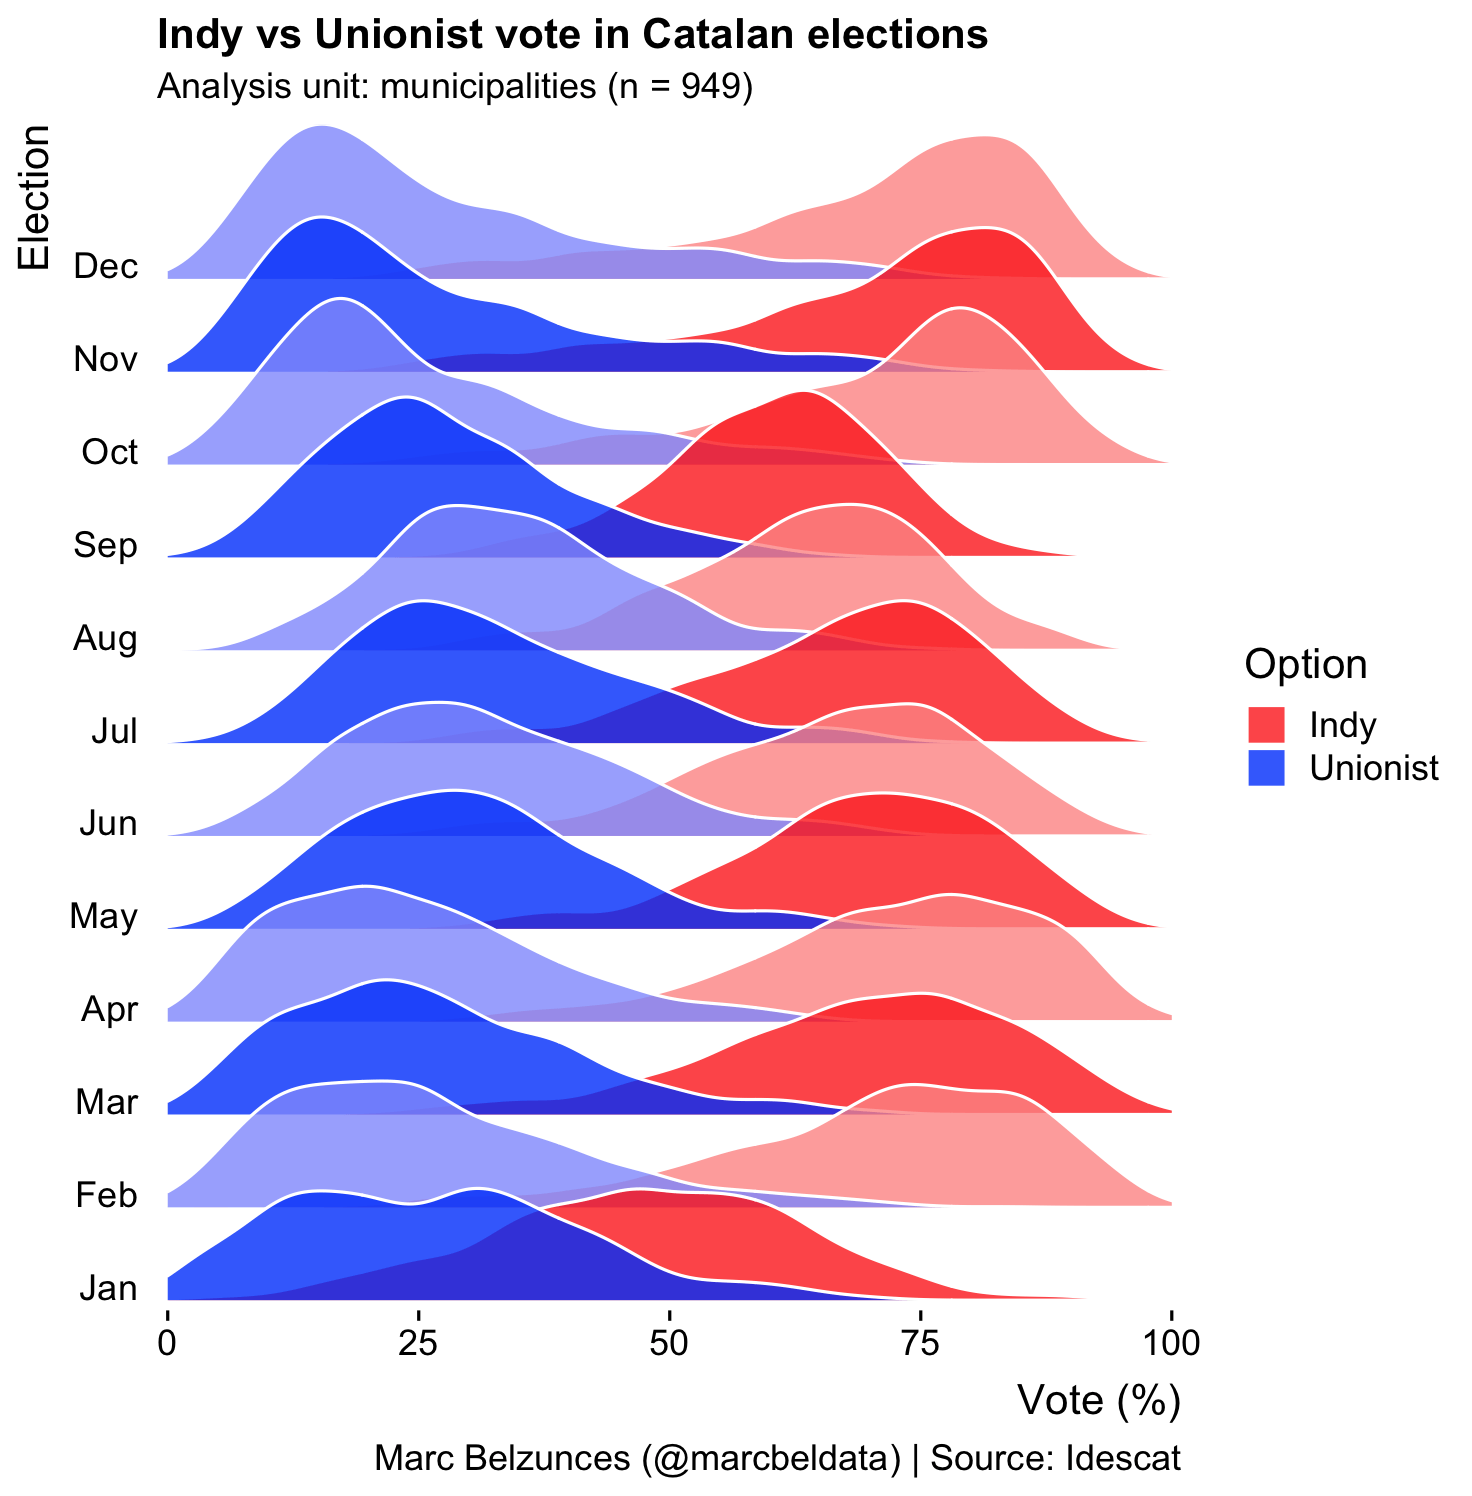
Воспроизводимый пример, показывающий использование символьных меток по оси Y для чередующихся цветов на основе примера / набора данных Catalan_elections:
library(data.table)
library(dplyr)
library(forcats)
library(ggridges)
library(ggplot2)

# Making ggridges work with alternating colors and character labels
# in the y-axis.
# The key points are:

# 1. Make sure you create the character-column to use  as a factor, using levels from the numeric values matching the labels to be used in the y-axis (e.g. month.abb)
# 2. For the aes(y=) call use the factor column just created in the prev. step
# 3. And for the fill use the combination of the numeric value and the grouping variable


# Get "Catalan_elections" dataset as a data.table
dt_Catalan_elections <- as.data.table(Catalan_elections)
# Add a block of data to meet the 12 months and match it with number of unique years.
dt_n <- dt_Catalan_elections[Year==2015,]
dt_n[,Year:=2016]
dt_new <- rbindlist(list(dt_Catalan_elections, dt_n))
old <- as.character(unique(dt_new$Year))
# For each year assign a month (e.g. 1980 - Jan, 1981 - Feb, etc)
dt_new[,month := factor(Year, levels = old, labels = month.abb)]

# get ggridges using month instead of Year for Y-axis labels
p <- dt_new %>%
      ggplot(aes(y = month)) +
      geom_density_ridges(
        aes(x = Percent, fill = paste(Year, Option)),
        alpha = .8, color = "white", from = 0, to = 100
      ) +
      labs(
        x = "Vote (%)",
        y = "Election",
        title = "Indy vs Unionist vote in Catalan elections",
        subtitle = "Analysis unit: municipalities (n = 949)",
        caption = "Marc Belzunces (@marcbeldata) | Source: Idescat"
      ) +
      scale_y_discrete(expand = c(0.01, 0)) +
      scale_x_continuous(expand = c(0.01, 0)) +
      scale_fill_cyclical(
        breaks = c("1980 Indy", "1980 Unionist"),
        labels = c(`1980 Indy` = "Indy", `1980 Unionist` = "Unionist"),
        values = c("#ff0000", "#0000ff", "#ff8080", "#8080ff"),
        name = "Option", guide = "legend"
      ) +
      theme_ridges(grid = FALSE)
print(p)

##


