Лучший способ построить угол между двумя линиями в Matplotlib
Я довольно новичок в использовании matplotlib и не могу найти примеров, которые показывают две линии с нанесенным на них углом между ними.
Это мое текущее изображение: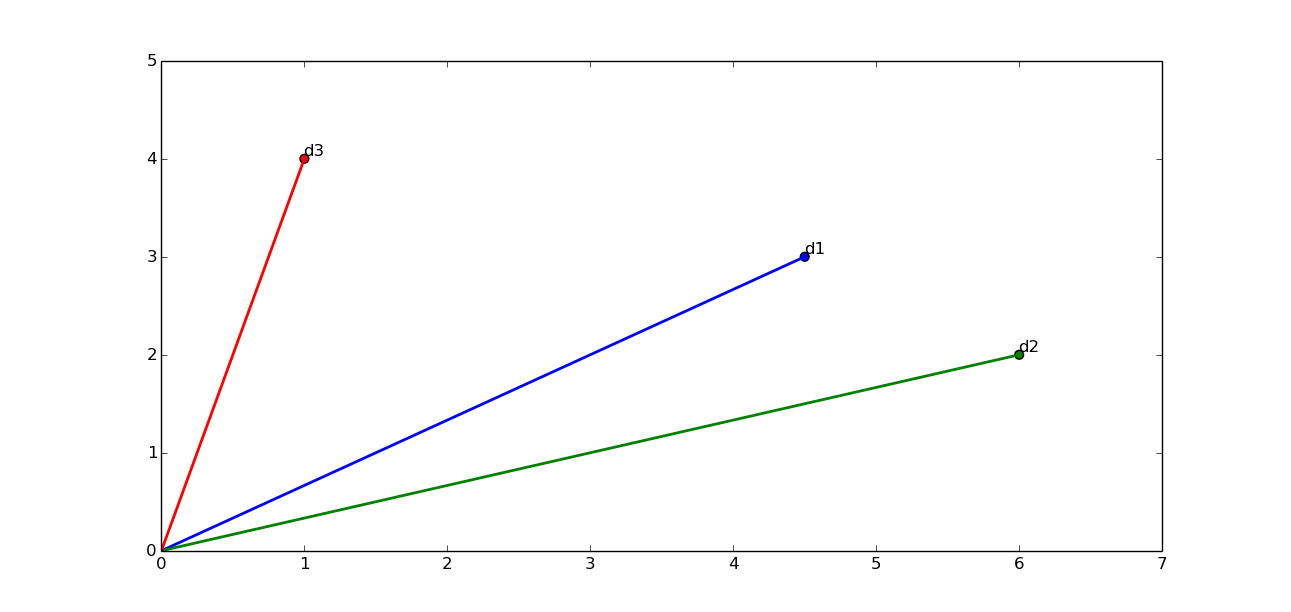
И это пример того, чего я хочу достичь:
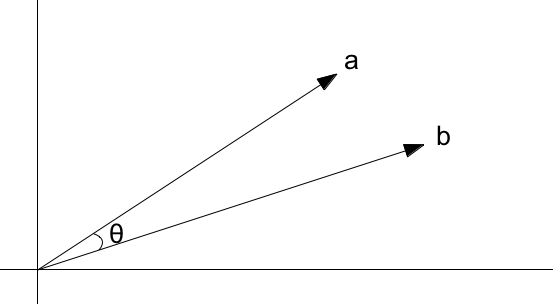
Я обычно заглядываю в галерею Matplotlib, чтобы получить представление о том, как выполнять определенные задачи, но, похоже, ничего подобного нет.
5 ответов
Вы могли бы использовать matplotlib.patches.Arc построить дугу соответствующего углового измерения.
Чтобы нарисовать угловую дугу:
Определите функцию, которая может занять 2 matplotlib.lines.Line2D объекты, рассчитать угол и вернуть matplotlib.patches.Arc объект, который вы можете добавить на свой участок вместе с линиями.
def get_angle_plot(line1, line2, offset = 1, color = None, origin = [0,0], len_x_axis = 1, len_y_axis = 1):

    l1xy = line1.get_xydata()

    # Angle between line1 and x-axis
    slope1 = (l1xy[1][1] - l1xy[0][2]) / float(l1xy[1][0] - l1xy[0][0])
    angle1 = abs(math.degrees(math.atan(slope1))) # Taking only the positive angle

    l2xy = line2.get_xydata()

    # Angle between line2 and x-axis
    slope2 = (l2xy[1][3] - l2xy[0][4]) / float(l2xy[1][0] - l2xy[0][0])
    angle2 = abs(math.degrees(math.atan(slope2)))

    theta1 = min(angle1, angle2)
    theta2 = max(angle1, angle2)

    angle = theta2 - theta1

    if color is None:
        color = line1.get_color() # Uses the color of line 1 if color parameter is not passed.

    return Arc(origin, len_x_axis*offset, len_y_axis*offset, 0, theta1, theta2, color=color, label = str(angle)+u"\u00b0")
Чтобы напечатать значения углов:
Если вы хотите, чтобы значение угла отображалось в строке, обратитесь к этому вопросу SO, чтобы узнать, как печатать встроенные метки в matplotlib. Обратите внимание, что вы должны напечатать этикетку для дуги.
Я сделал небольшую функцию, которая извлекает вершины дуги и пытается вычислить координату угла текста.
Это не может быть оптимальным и может не работать хорошо со всеми значениями угла.
def get_angle_text(angle_plot):
    angle = angle_plot.get_label()[:-1] # Excluding the degree symbol
    angle = "%0.2f"%float(angle)+u"\u00b0" # Display angle upto 2 decimal places

    # Get the vertices of the angle arc
    vertices = angle_plot.get_verts()

    # Get the midpoint of the arc extremes
    x_width = (vertices[0][0] + vertices[-1][0]) / 2.0
    y_width = (vertices[0][5] + vertices[-1][6]) / 2.0

    #print x_width, y_width

    separation_radius = max(x_width/2.0, y_width/2.0)

    return [ x_width + separation_radius, y_width + separation_radius, angle]
Или вы всегда можете предварительно вычислить точку метки вручную и использовать text для отображения значения угла. Вы можете получить значение угла из label из Arc объект с помощью get_label() метод (так как мы установили метку на значение угла + символ степени юникода).
Пример использования вышеуказанных функций:
fig = plt.figure()

line_1 = Line2D([0,1], [0,4], linewidth=1, linestyle = "-", color="green")
line_2 = Line2D([0,4.5], [0,3], linewidth=1, linestyle = "-", color="red")

ax = fig.add_subplot(1,1,1)

ax.add_line(line_1)
ax.add_line(line_2)

angle_plot = get_angle_plot(line_1, line_2, 1)
angle_text = get_angle_text(angle_plot)
# Gets the arguments to be passed to ax.text as a list to display the angle value besides the arc

ax.add_patch(angle_plot) # To display the angle arc
ax.text(*angle_text) # To display the angle value

ax.set_xlim(0,7)
ax.set_ylim(0,5)
Если вас не волнует встроенное размещение угла текста. Вы могли бы использовать plt.legend() напечатать значение угла.
В заключение:
plt.legend()
plt.show()
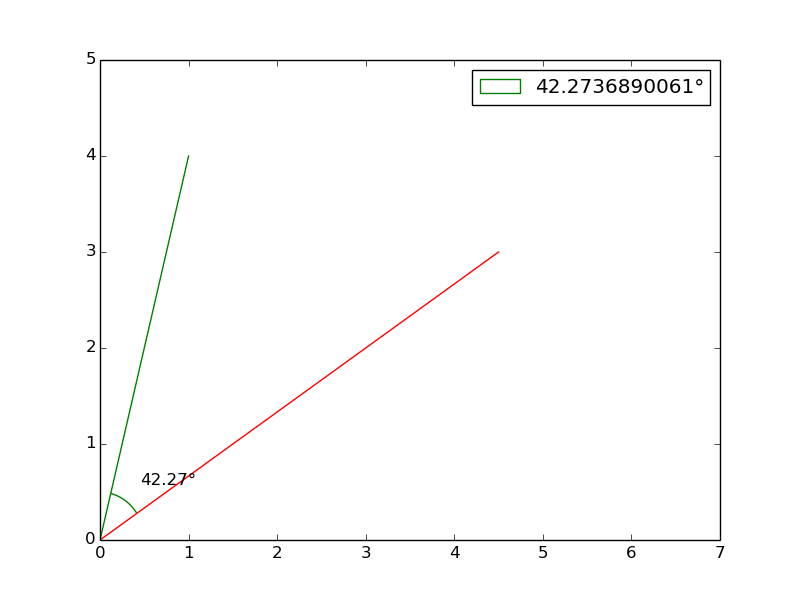
offset параметр в функции get_angle_plot используется для указания значения псевдо-радиуса для дуги.
Это будет полезно, когда угловые дуги могут перекрывать друг друга.
(На этом рисунке, как я уже сказал, мой get_angle_text функция не очень оптимальна при размещении текстового значения, но должна дать вам представление о том, как вычислить точку)
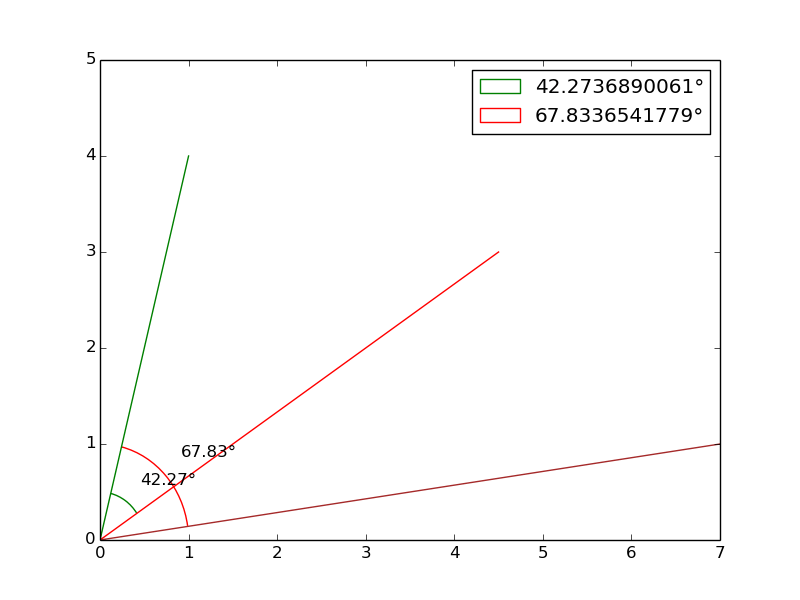
Добавление третьей строки:
line_3 = Line2D([0,7], [0,1], linewidth=1, linestyle = "-", color="brown")
ax.add_line(line_3)
angle_plot = get_angle_plot(line_1, line_3, 2, color="red") # Second angle arc will be red in color
angle_text = get_angle_text(angle_plot)

ax.add_patch(angle_plot) # To display the 2nd angle arc
ax.text(*angle_text) # To display the 2nd angle value
Я искал более универсальное решение и нашел класс AngleAnnotation. Я очень рекомендую это.
Часто бывает полезно отмечать углы между линиями или внутри фигур дугой окружности. Хотя Matplotlib предоставляет дугу, неотъемлемая проблема при ее прямом использовании для таких целей заключается в том, что дуга, являющаяся круговой в пространстве данных, не обязательно является круговой в пространстве отображения. Кроме того, радиус дуги часто лучше всего определять в системе координат, которая не зависит от фактических координат данных - по крайней мере, если вы хотите иметь возможность свободно увеличивать масштаб вашего графика без увеличения аннотации до бесконечности.
Вы можете найти его здесь https://matplotlib.org/stable/gallery/text_labels_and_annotations/angle_annotation.html Я сохраняю его как AngleAnnotation.py (конечно, вы можете назвать его по-другому) в моем рабочем каталоге и импортирую в свой код с помощью
from AngleAnnotation import AngleAnnotation
вот отрывок того, как я его использую:
      ...
#intersection of the two lines
center = (0.0,0.0)
#any point (other than center) on one line
p1 = (6,2)
# any point (other than center) on the other line
p2 = (6,0)
# you may need to switch around p1 and p2 if the arc is drawn enclosing the lines instead
# of between
# ax0 is the axes in which your lines exist
# size sets how large the arc will be
# text sets the label for your angle while textposition lets you rougly set where the label is, here "inside"
# you can pass kwargs to the textlabel using text_kw=dict(...)
# especially useful is the xytext argument which lets you customize the relative position of your label more precisely

am1 = AngleAnnotation(center, p1, p2, ax=ax0, size=130, text="some_label", textposition = "inside", text_kw=dict(fontsize=20, xytext = (10,-5)))
Вы можете найти более подробную информацию по ссылке выше. Сейчас он работает для меня на matplotlib 3.4.2.
Принимая идею от @user3197452 вот что я использую. Эта версия сочетает в себе text а также заботится о пропорциях пропорциональных осей.
def add_corner_arc(ax, line, radius=.7, color=None, text=None, text_radius=.5, text_rotatation=0, **kwargs):
    ''' display an arc for p0p1p2 angle
    Inputs:
        ax     - axis to add arc to
        line   - MATPLOTLIB line consisting of 3 points of the corner
        radius - radius to add arc
        color  - color of the arc
        text   - text to show on corner
        text_radius     - radius to add text
        text_rotatation - extra rotation for text
        kwargs - other arguments to pass to Arc
    '''

    lxy = line.get_xydata()

    if len(lxy) < 3:
        raise ValueError('at least 3 points in line must be available')

    p0 = lxy[0]
    p1 = lxy[1]
    p2 = lxy[2]

    width = np.ptp([p0[0], p1[0], p2[0]])
    height = np.ptp([p0[1], p1[1], p2[1]])

    n = np.array([width, height]) * 1.0
    p0_ = (p0 - p1) / n
    p1_ = (p1 - p1)
    p2_ = (p2 - p1) / n

    theta0 = -get_angle(p0_, p1_)
    theta1 = -get_angle(p2_, p1_)

    if color is None:
        # Uses the color line if color parameter is not passed.
        color = line.get_color()
    arc = ax.add_patch(Arc(p1, width * radius, height * radius, 0, theta0, theta1, color=color, **kwargs))

    if text:
        v = p2_ / np.linalg.norm(p2_)
        if theta0 < 0:
            theta0 = theta0 + 360
        if theta1 < 0:
            theta1 = theta1 + 360
        theta = (theta0 - theta1) / 2 + text_rotatation
        pt = np.dot(rotation_transform(theta), v[:,None]).T * n * text_radius
        pt = pt + p1
        pt = pt.squeeze()
        ax.text(pt[0], pt[1], text,
                horizontalalignment='left',
                verticalalignment='top',)

    return arc
get_angle Функция - это то, что я выложил здесь, но скопировал снова для полноты.
def get_angle(p0, p1=np.array([0,0]), p2=None):
    ''' compute angle (in degrees) for p0p1p2 corner
    Inputs:
        p0,p1,p2 - points in the form of [x,y]
    '''
    if p2 is None:
        p2 = p1 + np.array([1, 0])
    v0 = np.array(p0) - np.array(p1)
    v1 = np.array(p2) - np.array(p1)

    angle = np.math.atan2(np.linalg.det([v0,v1]),np.dot(v0,v1))
    return np.degrees(angle)

def rotation_transform(theta):
    ''' rotation matrix given theta
    Inputs:
        theta    - theta (in degrees)
    '''
    theta = np.radians(theta)
    A = [[np.math.cos(theta), -np.math.sin(theta)],
         [np.math.sin(theta), np.math.cos(theta)]]
    return np.array(A)
Чтобы использовать это можно сделать это:
ax = gca()
line, = ax.plot([0, 0, 2], [-1, 0, 0], 'ro-', lw=2)
add_corner_arc(ax, line, text=u'%d\u00b0' % 90)
Я написал функцию для создания объекта Arc matplotlib, который принимает несколько полезных аргументов. Он также работает с линиями, которые не пересекаются в начале координат. Для данного набора из двух линий существует множество возможных дуг, которые пользователь может захотеть нарисовать. Эта функция позволяет указать, какой из них использует аргументы. Текст рисуется посередине между дугой и началом координат. Улучшения более чем приветствуются в комментариях или по сути, содержащей эту функцию .
      import numpy as np
import matplotlib
import matplotlib.pyplot as plt
Arc = matplotlib.patches.Arc

def halfangle(a, b):
    "Gets the middle angle between a and b, when increasing from a to b"
    if b < a:
        b += 360
    return (a + b)/2 % 360

def get_arc_patch(lines, radius=None, flip=False, obtuse=False, reverse=False, dec=0, fontsize=8):
    """For two sets of two points, create a matplotlib Arc patch drawing
    an arc between the two lines.

    lines: list of lines, of shape [[(x0, y0), (x1, y1)], [(x0, y0), (x1, y1)]]
    radius: None, float or tuple of floats. If None, is set to half the length
    of the shortest line
    orgio: If True, draws the arc around the point (0,0). If False, estimates
    the intersection of the lines and uses that point.
    flip: If True, flips the arc to the opposite side by 180 degrees
    obtuse: If True, uses the other set of angles. Often used with reverse=True.
    reverse: If True, reverses the two angles so that the arc is drawn
    "the opposite way around the circle"
    dec: The number of decimals to round to
    fontsize: fontsize of the angle label
    """
    import numpy as np
    from matplotlib.patches import Arc

    linedata = [np.array(line.T) for line in lines]
    scales = [np.diff(line).T[0] for line in linedata]
    scales = [s[1] / s[0] for s in scales]

    # Get angle to horizontal
    angles = np.array([np.rad2deg(np.arctan(s/1)) for s in scales])
    if obtuse:
        angles[1] = angles[1] + 180
    if flip:
        angles += 180
    if reverse:
        angles = angles[::-1]

    angle = abs(angles[1]-angles[0])

    if radius is None:
        lengths = np.linalg.norm(lines, axis=(0,1))
        radius = min(lengths)/2

    # Solve the point of intersection between the lines:
    t, s = np.linalg.solve(np.array([line1[1]-line1[0], line2[0]-line2[1]]).T, line2[0]-line1[0])
    intersection = np.array((1-t)*line1[0] + t*line1[1])
    # Check if radius is a single value or a tuple
    try:
        r1, r2 = radius
    except:
        r1 = r2 = radius
    arc = Arc(intersection, 2*r1, 2*r2, theta1=angles[1], theta2=angles[0])

    half = halfangle(*angles[::-1])
    sin = np.sin(np.deg2rad(half))
    cos = np.cos(np.deg2rad(half))

    r = r1*r2/(r1**2*sin**2+r2**2*cos**2)**0.5
    xy = np.array((r*cos, r*sin))
    xy =  intersection + xy/2

    textangle = half if half > 270 or half < 90 else 180 + half
    textkwargs = {
        'x':xy[0],
        'y':xy[1],
        's':str(round(angle, dec)) + "°",
        'ha':'center',
        'va':'center',
        'fontsize':fontsize,
        'rotation':textangle
    }
    return arc, textkwargs
Он создает дуги, как на следующем изображении, используя прикрепленный скрипт: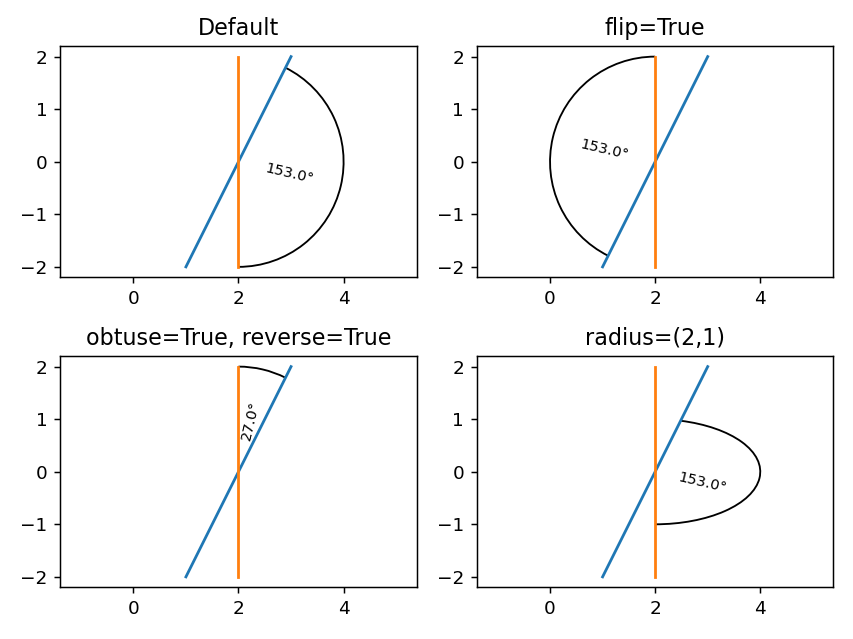
      import numpy as np
import matplotlib.pyplot as plt
from matplotlib.patches import Arc
# lines are formatted like this: [(x0, y0), (x1, y1)]
line1 = np.array([(1,-2), (3,2)])
line2 = np.array([(2,2), (2,-2)])
lines = [line1, line2]

fig, AX = plt.subplots(nrows=2, ncols=2)
for ax in AX.flatten():
    for line in lines:
        x,y = line.T
        ax.plot(x,y)
        ax.axis('equal')

ax1, ax2, ax3, ax4 = AX.flatten()

arc, angle_text = get_arc_patch(lines)
ax1.add_artist(arc)
ax1.set(title='Default')
ax1.text(**angle_text)

arc, angle_text = get_arc_patch(lines, flip=True)
ax2.add_artist(arc)
ax2.set(title='flip=True')
ax2.text(**angle_text)

arc, angle_text = get_arc_patch(lines, obtuse=True, reverse=True)
ax3.add_artist(arc)
ax3.set(title='obtuse=True, reverse=True')
ax3.text(**angle_text)

arc, angle_text = get_arc_patch(lines, radius=(2,1))
ax4.add_artist(arc)
ax4.set(title='radius=(2,1)')
ax4.text(**angle_text)
plt.tight_layout()
plt.show()
Я нахожу подход TomNorway лучше, он более гибок в других случаях, чем принятый ответ. Я протестировал код и сделал несколько быстрых исправлений для еще большей применимости, создав класс.
      import numpy as np
import matplotlib
import matplotlib.pyplot as plt
from matplotlib.patches import Arc

class LinesAngles:
    def __init__(self, line1, line2, radius=None, flip=False, obtuse=False, reverse=False, dec=0, fontsize=8, title=""):
        """
        line1: list of two points, of shape [[x0, y0], [x1, y1]]
        line2: list of two points, of shape [[x0, y0], [x1, y1]]
        radius: None, float or tuple of floats. If None, is set to half the length
            of the shortest line orgio: If True, draws the arc around the point (0,0). If False, estimates
            the intersection of the lines and uses that point.
        flip: If True, flips the arc to the opposite side by 180 degrees
        obtuse: If True, uses the other set of angles. Often used with reverse=True.
        reverse: If True, reverses the two angles so that the arc is drawn "the opposite way around the circle"
        dec: The number of decimals to round to
        fontsize: fontsize of the angle label
        title: Title of the plot
        """
        self.line1 = line1
        self.line2 = line2
        self.lines = [line1, line2]
        self.radius = radius
        self.flip = flip
        self.obtuse = obtuse
        self.reverse = reverse
        self.dec = dec
        self.fontsize = fontsize
        self.title = title

    def halfangle(self,a, b) -> float:
        """
        Gets the middle angle between a and b, when increasing from a to b
        a: float, angle in degrees
        b: float, angle in degrees
        returns: float, angle in degrees
        """
        if b < a:
            b += 360
        return (a + b)/2 % 360

    def get_arc_patch(self, lines: list):
        """
        For two sets of two points, create a matplotlib Arc patch drawing
        an arc between the two lines.
        lines: list of lines, of shape [[(x0, y0), (x1, y1)], [(x0, y0), (x1, y1)]]
        returns: Arc patch, and text for the angle label
        """

        linedata = [np.array(line.T) for line in lines]
        scales = [np.diff(line).T[0] for line in linedata]
        scales = [s[1] / s[0] for s in scales]

        # Get angle to horizontal
        angles = np.array([np.rad2deg(np.arctan(s/1)) for s in scales])
        if self.obtuse:
            angles[1] = angles[1] + 180
        if self.flip:
            angles += 180
        if self.reverse:
            angles = angles[::-1]

        angle = abs(angles[1]-angles[0])

        if self.radius is None:
            lengths = np.linalg.norm(lines, axis=(0,1))
            self.radius = min(lengths)/2

        # Solve the point of intersection between the lines:
        t, s = np.linalg.solve(np.array([line1[1]-line1[0], line2[0]-line2[1]]).T, line2[0]-line1[0])
        intersection = np.array((1-t)*line1[0] + t*line1[1])
        # Check if radius is a single value or a tuple
        try:
            r1, r2 = self.radius
        except:
            r1 = r2 = self.radius
        arc = Arc(intersection, 2*r1, 2*r2, theta1=angles[1], theta2=angles[0])

        half = self.halfangle(*angles[::-1])
        sin = np.sin(np.deg2rad(half))
        cos = np.cos(np.deg2rad(half))

        r = r1*r2/(r1**2*sin**2+r2**2*cos**2)**0.5
        xy = np.array((r*cos, r*sin))
        xy =  intersection + xy/2

        textangle = half if half > 270 or half < 90 else 180 + half
        textkwargs = {
            'x':xy[0],
            'y':xy[1],
            's':str(round(angle, self.dec)) + "°",
            'ha':'center',
            'va':'center',
            'fontsize':self.fontsize,
            'rotation':textangle
        }
        return arc, textkwargs

    def plot(self) -> None:
        """!
        Plot the lines and the arc
        """

        fig = plt.figure()
        ax = fig.add_subplot(1,1,1)

        for line in self.lines:
            x,y = line.T
            ax.plot(x,y)
            ax.axis('equal')

        arc, angle_text = self.get_arc_patch(self.lines)
        ax.add_artist(arc)
        ax.set(title=self.title)
        ax.text(**angle_text)
        plt.show()
Для его использования вы просто создаете экземпляр и функцию графика.
      # lines are formatted like this: [(x0, y0), (x1, y1)]
line1 = np.array([(1,-2), (3,2)])
line2 = np.array([(2,2), (2,-2)])
default = LinesAngles(line1, line2, title="Default")
#Plot single pair of lines
default.plot()
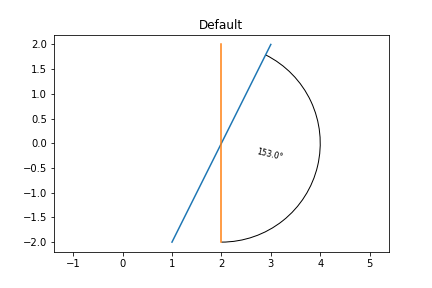
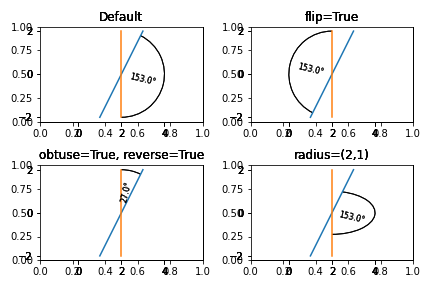
Если вы все еще хотите построить несколько случаев, я создал функцию, которая принимает экземпляры и автоматически отображает нужные вам подграфики.
      # lines are formatted like this: [(x0, y0), (x1, y1)]
line1 = np.array([(1,-2), (3,2)])
line2 = np.array([(2,2), (2,-2)])
default = LinesAngles(line1, line2, title="Default")
flip = LinesAngles(line1, line2, title='flip=True', flip=True)
obtuse = LinesAngles(line1, line2, title='obtuse=True, reverse=True', obtuse=True, reverse=True)
radius = LinesAngles(line1, line2, title='radius=(2,1)', radius=(2,1))

#Plot single pair of lines
default.plot()
#Plot multiple line pairs
multiple_plot(default, flip, obtuse, radius, num_subplots=4)
Спасибо TomNorway за его ответ, вся заслуга в нем, я только внес некоторые изменения.