Нарисовать линию на geom_density_ridges
Я пытаюсь провести линию через графики плотности от ggridges
library(ggplot2)
library(ggridges)
ggplot(iris, aes(x = Sepal.Length, y = Species)) +
  geom_density_ridges(rel_min_height = 0.01)
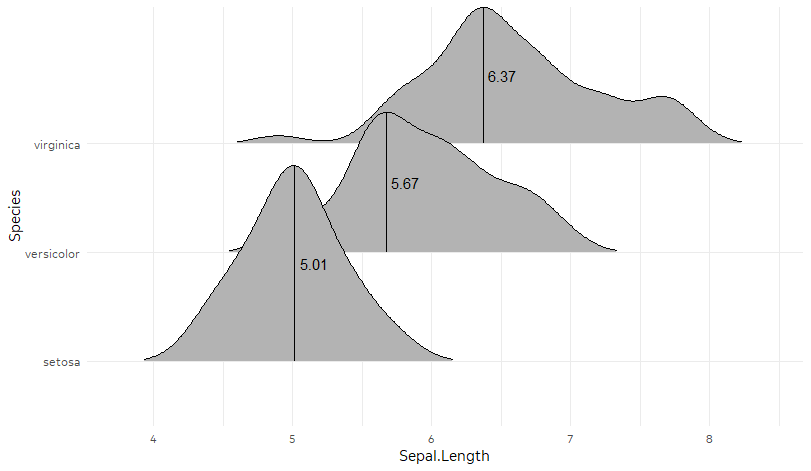
Указание наивысшей точки и обозначение значения х в этой точке. Примерно так ниже. Любые предложения по выполнению этого высоко ценится
1 ответ
Решение
Один из аккуратных подходов - опросить сам объект ggplot и использовать его для создания дополнительных функций:
# This is the OP chart
library(ggplot2)
library(ggridges)
gr <- ggplot(iris, aes(x = Sepal.Length, y = Species)) +
  geom_density_ridges(rel_min_height = 0.01)
Изменить: Следующая часть была сокращена, используя purrr::pluck извлечь целое data часть списка, вместо того, чтобы вручную указывать столбцы, которые нам понадобятся позже.
# Extract the data ggplot used to prepare the figure.
# purrr::pluck is grabbing the "data" list from the list that
# ggplot_build creates, and then extracting the first element of that list.
ingredients <- ggplot_build(gr) %>% purrr::pluck("data", 1)
# Pick the highest point. Could easily add quantiles or other features here.
density_lines <- ingredients %>%
group_by(group) %>% filter(density == max(density)) %>% ungroup()
# Use the highest point to add more geoms
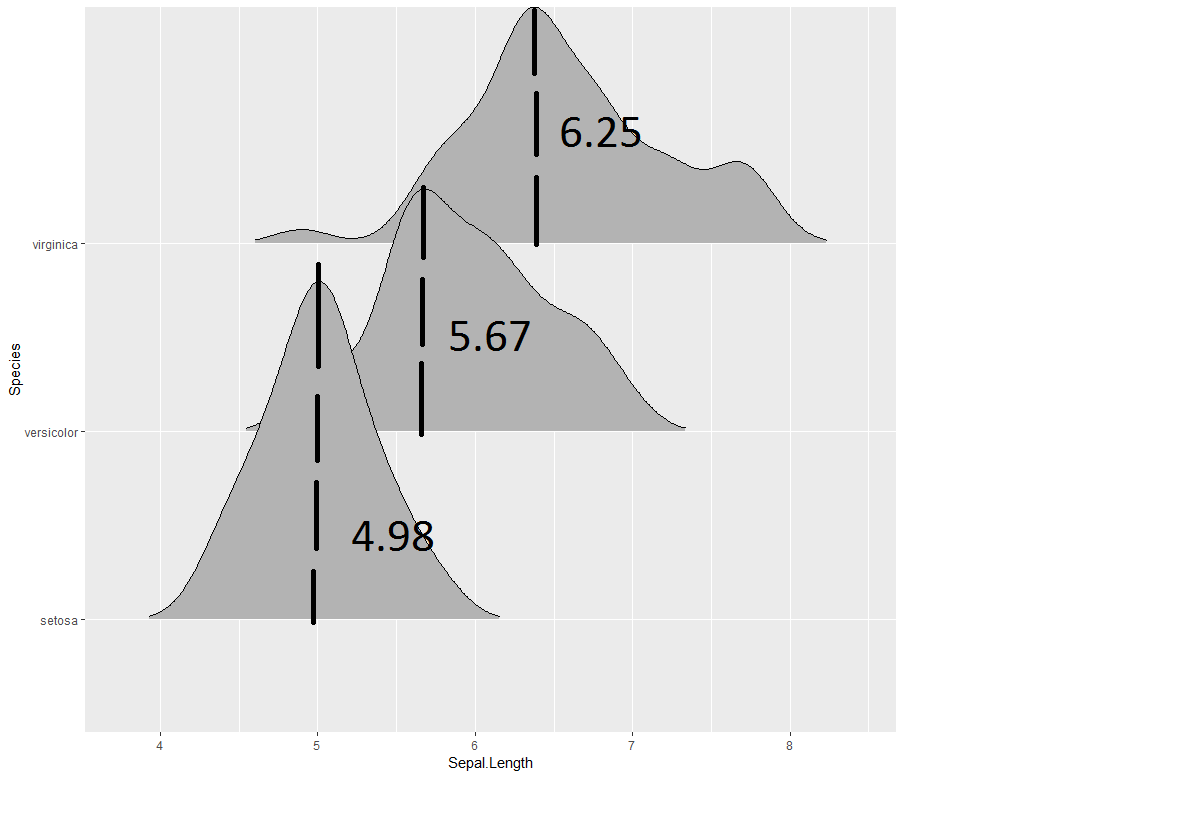
ggplot(iris, aes(x = Sepal.Length, y = Species)) +
geom_density_ridges(rel_min_height = 0.01) +
geom_segment(data = density_lines,
aes(x = x, y = ymin, xend = x,
yend = ymin+density*scale*iscale)) +
geom_text(data = density_lines,
aes(x = x, y = ymin + 0.5 *(density*scale*iscale),
label = round(x, 2)),
hjust = -0.2)