Изменение точки зрения на 3D-графиках в Matplotlib
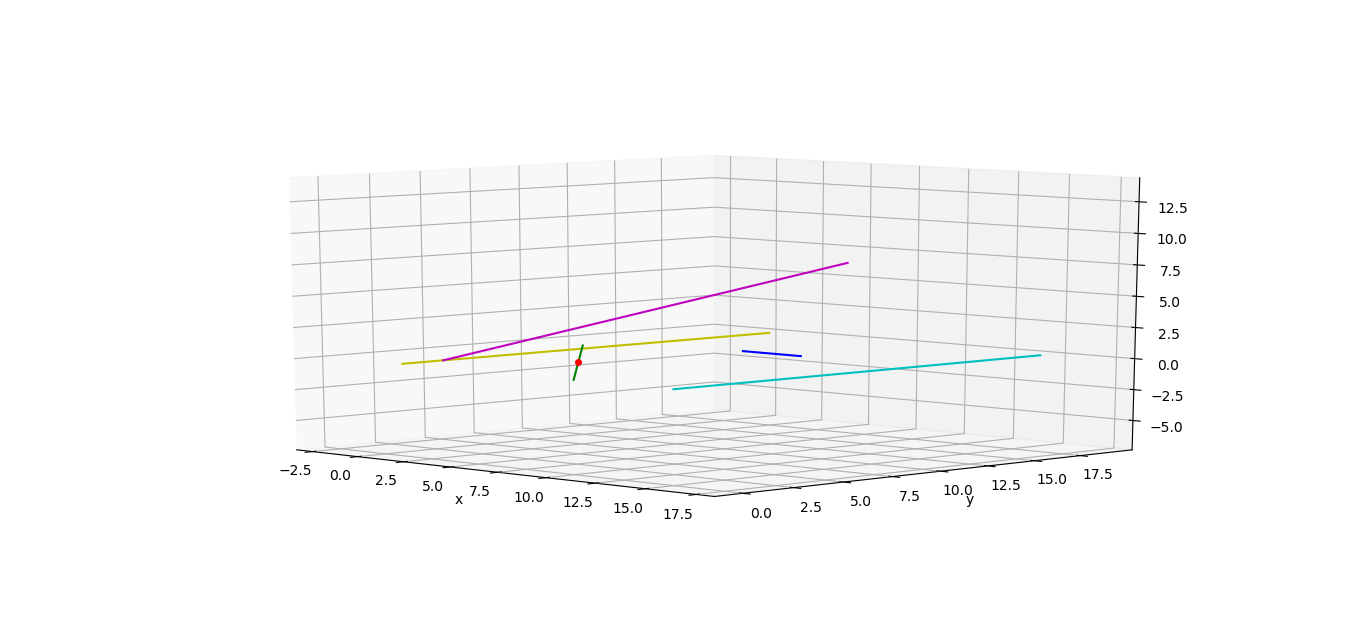
Я пытаюсь изменить вид трехмерного графика, как будто я стою в красной точке, смотря в направлении зеленой линии. Установка азимутального угла обзора равным наклону учитывает направление. Тем не менее, увеличение до уровня красной точки является проблемой. я знаю это ax.dist это ключ, но я не знаю, как правильно его использовать. Если красная точка не находится в середине графика, она исчезнет с обзора после определенного уровня масштабирования.
и вот код
import numpy as np
import matplotlib.pyplot as plt

fig = plt.figure()
ax = fig.gca(projection='3d')

def set_axes_equal(ax):
    '''Make axes of 3D plot have equal scale so that spheres appear as spheres,
    cubes as cubes, etc..  This is one possible solution to Matplotlib's
    ax.set_aspect('equal') and ax.axis('equal') not working for 3D.

    Input
      ax: a matplotlib axis, e.g., as output from plt.gca().
    '''

    x_limits = ax.get_xlim3d()
    y_limits = ax.get_ylim3d()
    z_limits = ax.get_zlim3d()

    x_range = abs(x_limits[1] - x_limits[0])
    x_middle = np.mean(x_limits)
    y_range = abs(y_limits[1] - y_limits[0])
    y_middle = np.mean(y_limits)
    z_range = abs(z_limits[1] - z_limits[0])
    z_middle = np.mean(z_limits)

    # The plot bounding box is a sphere in the sense of the infinity
    # norm, hence I call half the max range the plot radius.
    plot_radius = 0.5*max([x_range, y_range, z_range])

    ax.set_xlim3d([x_middle - plot_radius, x_middle + plot_radius])
    ax.set_ylim3d([y_middle - plot_radius, y_middle + plot_radius])
    ax.set_zlim3d([z_middle - plot_radius, z_middle + plot_radius])


y1 = range(20)
x1 = [1] * len(y1)
x2 = np.array(range(11))
y2 = -x2 + 10
x3 = np.array(range(1, 9))
y3 = x3 * 2
z3 = range(len(x3))
x4 = range(6, 10)
y4 = [12.5] * len(x4)
y5 = range(20)
x5 = [15] * len(y5)

ax.plot(x1, y1, color = 'y')
ax.plot(x2, y2, color = 'g')
ax.plot([5], [5], [0], 'or', markersize = 4)
ax.plot(x3, y3, z3, color = 'm')
ax.plot(x4, y4, color = 'b')
ax.plot(x5, y5, color = 'c')


set_axes_equal(ax)
ax.set_xlabel("x")
ax.set_ylabel("y")
azi = np.degrees(np.arctan((x2[-1]-x2[0])/(y2[-1]-y2[0])))
ax.view_init(elev = 10, azim = azi)
ax.dist = 10

plt.show()
set_axes_equal(ax) берется отсюда.
Как сохранить красную точку в представлении и как рассчитать точный ax.dist значение?
