"Недопустимое значение для <path>" при создании круговой диаграммы в Plottable/D3.js
У меня есть код из трех частей (HTML и JavaScript). Их можно скачать здесь:
index.html
<!doctype html>
<html>
<head>
    <meta charset="UTF-8">

    <!-- Later add new CSS to define the placement of the legend, fold change etc -->
</head>


<body>


    <!-- Show pies -->
    <div id="sample-pies"></div>


    <!-- Act on the thing -->
    <script src="https://cdnjs.cloudflare.com/ajax/libs/jquery/3.0.0-alpha1/jquery.js"></script>
    <script src="https://cdnjs.cloudflare.com/ajax/libs/lodash.js/3.10.1/lodash.js" ></script>

    <link href="http://plottablejs.org/assets/css/application.min.css" rel="stylesheet"/>
    <link href="https://cdnjs.cloudflare.com/ajax/libs/plottable.js/1.12.0/plottable.css" rel="stylesheet"/>

    <link href="http://plottablejs.org/assets/css/application.min.css" rel="stylesheet"/>
    <script src="https://cdnjs.cloudflare.com/ajax/libs/d3/3.4.11/d3.min.js"></script>
    <script src="https://cdnjs.cloudflare.com/ajax/libs/plottable.js/1.12.0/plottable.js"></script>
    <link href="https://cdnjs.cloudflare.com/ajax/libs/plottable.js/1.12.0/plottable.css" rel="stylesheet"/>

    <script src="pie_app.js"></script>
    <script src="pie.js"></script>

</body>
</html>
pie_app.js
jQuery(

   function ($) {
    "use strict";

    var pies;

    var indata = [
        { 'sample' : "Foo",
            "pies_pct":[
                        {
                            "score": 6.7530200000000002,
                            "celltype": "Bcells"
                        },
                        {
                            "score": 11.432763461538459,
                            "celltype": "DendriticCells"
                        },

                ]

    },
    { 'sample' : "Bar",
      "pies_pct":[
                        {
                            "score": 5.1335499999999996,
                            "celltype": "Bcells"
                        },
                        {
                            "score": 85.1618225,
                            "celltype": "DendriticCells"
                        }

      ]

    }
 ];


       processData(indata);

       function processData(data) {
            pies = data.map(function (data) {
            var pct_vals = data.pies_pct;

            return {
                title: data.sample,
                dataset: pct_vals
            };
        });


        buildPlots();

    }


function buildPlots () {
        var $pieContainer = $('#sample-pies');

        pies.forEach(function (pie, index) {
            var elementId = "sample-pie-" + index;

            $(document.createElementNS('http://www.w3.org/2000/svg', 'svg'))
                .css({width: '200px', height: '200px', display: 'inline-block'})
                .attr('id', elementId)
                .appendTo($pieContainer);


            plotSamplePie(pie.title, pie.dataset, '#' + elementId);
        });

    }

}


);
pie.js
(

 function (window) {
    "use strict";
    var scale = new Plottable.Scales.Linear();
    var tableau20 = ['#1F77B4', '#FF7F0E', '#2CA02C', '#D62728',
                     '#9467BD', '#8C564B', '#CFECF9', '#7F7F7F', '#BCBD22', '#17BECF'];
    var colorScale = new Plottable.Scales.Color();
    var legend = new Plottable.Components.Legend(colorScale);
    colorScale.range(tableau20);


    function plotSamplePie(title,purity_data,targetElement) {

        var titleLabel = new Plottable.Components.TitleLabel(title);
        var plot = new Plottable.Plots.Pie()
            .addDataset(new Plottable.Dataset(purity_data))
            .attr("fill", function(d) { return d.score; }, colorScale)
            .sectorValue(function(d) { return d.score; }, scale)
            .labelsEnabled(true);


        new Plottable.Components.Table([
            [titleLabel],
            [plot]
        ]).renderTo(targetElement);
    }

    function drawPieLegend(targetElement) {
        new Plottable.Components.Legend(colorScale) .renderTo(targetElement);
    }


    window.plotSamplePie = plotSamplePie;

}
)(this);
Я получил сообщение об ошибке в Chrome:
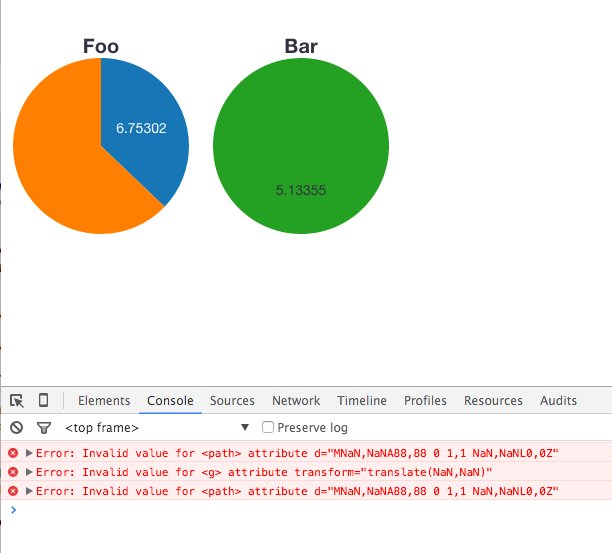
Смотрите, что круговая диаграмма Bar отображается неправильно (все зеленые).
Ошибка возникает только тогда, когда я запускаю как 3 части кода, как указано выше. Как я могу решить это?
Мой ожидаемый сюжет может быть показан здесь. Так что обратите внимание, что это работает в скрипках здесь. Но не выполняется как 3 части кода, как указано выше.
var indata = [{
  'sample': "Foo",
  "pies_pct": [{
    "score": 6.7530200000000002,
    "celltype": "Bcells"
  }, {
    "score": 11.432763461538459,
    "celltype": "DendriticCells"
  }]

}, {
  'sample': "Bar",
  "pies_pct": [{
    "score": 26.8530200000000002,
    "celltype": "Bcells"
  }, {
    "score": 31.432763461538459,
    "celltype": "DendriticCells"
  }]

}, ];

 var indata2 = [
        { 'sample' : "Foo",
            "pies_pct":[
                        {
                            "score": 6.7530200000000002,
                            "celltype": "Bcells"
                        },
                        {
                            "score": 11.432763461538459,
                            "celltype": "DendriticCells"
                        },

                ]

    },
    { 'sample' : "Bar",
      "pies_pct":[
                        {
                            "score": 5.1335499999999996,
                            "celltype": "Bcells"
                        },
                        {
                            "score": 85.1618225,
                            "celltype": "Monocytes"
                        }

      ]

    }
 ];


processData(indata2);

function processData(data) {

  pies = data.map(function(data) {
    return {
      title: data.sample,
      dataset: data.pies_pct
    };


  });

  buildPlots();
}

function buildPlots() {
  var $pieContainer = $('#sample-pies');

  pies.forEach(function(pie, index) {
    var elementId = "sample-pie-" + index;

    $(document.createElementNS('http://www.w3.org/2000/svg', 'svg'))
      .css({
        width: '200px',
        height: '200px',
        display: 'inline-block'
      })
      .attr('id', elementId)
      .appendTo($pieContainer);


    plotSamplePie(pie.title, pie.dataset, '#' + elementId);
  });


}


function plotSamplePie(title, purity_data, targetElement) {
  var scale = new Plottable.Scales.Linear();
  var tableau20 = ['#1F77B4', '#FF7F0E', '#2CA02C', '#D62728',
    '#9467BD', '#8C564B', '#CFECF9', '#7F7F7F', '#BCBD22', '#17BECF'
  ];
  var colorScale = new Plottable.Scales.Color();
  var legend = new Plottable.Components.Legend(colorScale);
  colorScale.range(tableau20);


  var titleLabel = new Plottable.Components.TitleLabel(title);
  var plot = new Plottable.Plots.Pie()
    .addDataset(new Plottable.Dataset(purity_data))
    .attr("fill", function(d) {
      return d.score;
    }, colorScale)
    .sectorValue(function(d) {
      return d.score;
    }, scale)
    .labelsEnabled(true);


  new Plottable.Components.Table([
    [titleLabel],
    [plot]
  ]).renderTo(targetElement);

}
<html>
<head>
<link href="https://cdnjs.cloudflare.com/ajax/libs/plottable.js/1.15.0/plottable.css" rel="stylesheet" />
<link href="https://cdnjs.cloudflare.com/ajax/libs/qtip2/2.2.1/basic/jquery.qtip.css" rel="stylesheet" />
</head>
<body>
My Plot
<!-- Show histograms -->
<div id="sample-pies"></div>
<script src="https://ajax.googleapis.com/ajax/libs/jquery/2.1.4/jquery.min.js"></script>
<script src="https://cdnjs.cloudflare.com/ajax/libs/lodash.js/3.10.1/lodash.js"></script>
<script src="https://cdnjs.cloudflare.com/ajax/libs/d3/3.4.11/d3.min.js"></script>
<script src="https://cdnjs.cloudflare.com/ajax/libs/plottable.js/1.15.0/plottable.js"></script>
</body>
</html>1 ответ
Решение
Похоже, вы передаете scale в sectorValue(), но это не должно быть необходимым. Изменение вызова на
.sectorValue(function(d) { return d.score; })
достает меня это:

Надеюсь, это поможет!
PS Вы можете немного почистить этикетки, установив labelFormatter() на Pie,