Выравнивание чисел на отдельных барах с ggplot2
Я хочу показать цифры на отдельных столбцах на следующем графике.
df <- structure(list(A = structure(c(1L, 1L, 1L, 2L, 2L, 2L, 3L, 3L,
3L), .Label = c("0-50,000", "50,001-250,000", "250,001-Over"), class = "factor"),
    B = structure(c(1L, 2L, 3L, 1L, 2L, 3L, 1L, 2L, 3L), .Label = c("0-50,000",
    "50,001-250,000", "250,001-Over"), class = "factor"), Freq = c(0.507713884992987,
    0.258064516129032, 0.23422159887798, 0.168539325842697, 0.525280898876405,
    0.306179775280899, 0.160958904109589, 0.243150684931507,
    0.595890410958904)), .Names = c("A", "B", "Freq"), class = "data.frame", row.names = c(NA,
-9L))

library(ggplot2)
p <- ggplot(data=df, aes(x=A, y=Freq))+
            geom_bar(aes(fill=B), position=position_dodge()) + theme_bw()
p <- p + scale_y_continuous(formatter="percent")
p <- p + geom_text(aes(label = paste(sprintf("%.1f", Freq*100), "%", sep=""), y = Freq+0.015, x=A), size = 3)
print(p)
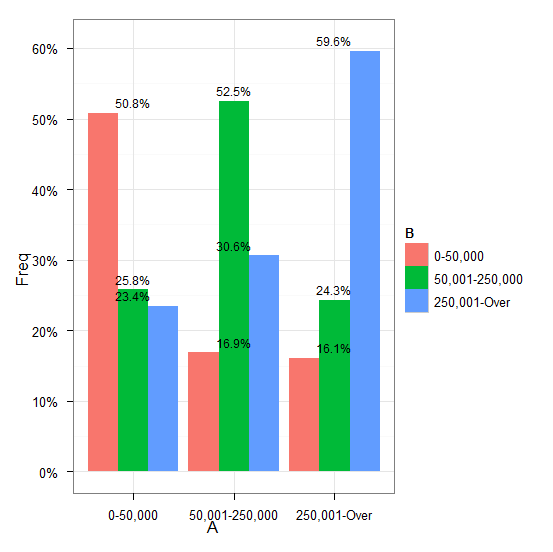
Я не мог понять, как поставить цифры в правильном положении вдоль оси X. Любая помощь будет высоко ценится. Спасибо
1 ответ
Решение
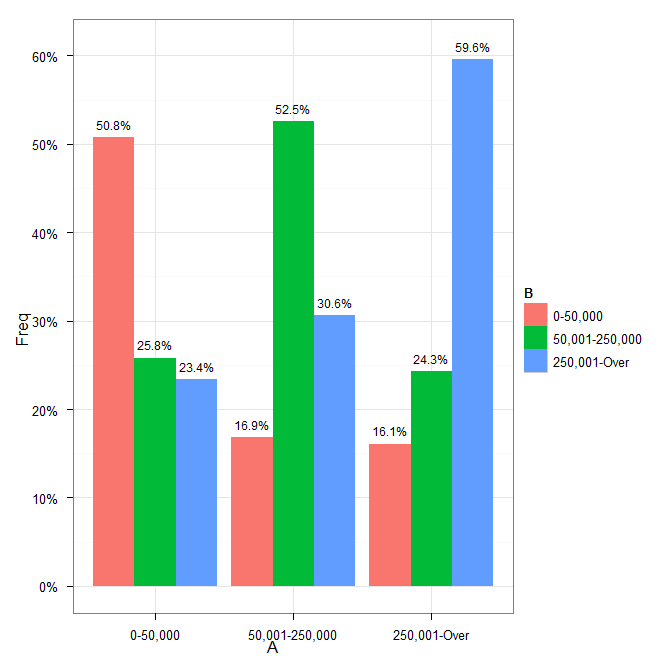
Вам нужно добавить position=position_dodge(width=0.9) на вызов geom_text.
Небольшая очистка вашего кода дает:
p <- ggplot(data=df, aes(x=A, y=Freq))+
    geom_bar(aes(fill=B), position = position_dodge()) +
    geom_text(aes(label = paste(sprintf("%.1f", Freq*100), "%", sep=""),
                  y = Freq+0.015, x=A),
              size = 3, position = position_dodge(width=0.9)) +
    scale_y_continuous(formatter = "percent") +
    theme_bw()
что приводит к