Ярлыки Chartjs с индексами
Я использую чарты для рисования радиолокационной карты.
Значение отображается при наведении курсора на точку графика, но я бы хотел всегда показывать это значение. Мне нужно изменить представление, чтобы показать данные при печати страницы.
Это мой текущий график. Метка отображается при наведении

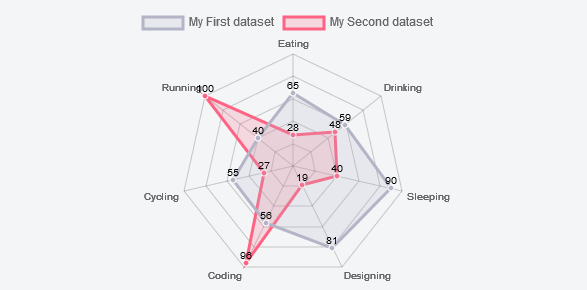
Я хочу показать значение всегда, как на следующем изображении 
2 ответа
Следующий ответ работает только для Chart.js v2.
Если вы хотите решение v1, проверьте притишвайдя.
Вы хотите использовать animation свойство параметров диаграммы:
options : {
    animation: {
        duration: 500,
        onComplete: function () {
            // The code here will be executed at the end of the animation
            // (after 500ms here)

            // You can get the canvas context using the following :
            var ctx = this.chart.ctx;
            // `this` being the chart instance
        }
    }
}
Теперь вы хотите добавить значение точки над ним, что можно сделать с помощью модели данных, которую вы можете найти в свойствах набора данных:
onComplete: function() {
    // You get the canvas context, to help you writing what you want
    var ctx = this.chart.ctx;

    // Here you set the context with what you need (font, size, color ...)
    ctx.font = Chart.helpers.fontString(Chart.defaults.global.defaultFontFamily, 'normal', Chart.defaults.global.defaultFontFamily);
    ctx.textAlign = 'center';
    ctx.fillStyle = 'black';

    // For every dataset ...
    this.data.datasets.forEach(function(dataset) {

        // For every data in the dataset ...
        for (var i = 0; i < dataset.data.length; i++) {

            // We get its model
            var model = dataset._meta[0].data[i]._model;

            // And write the data above it
            ctx.fillText(dataset.data[i], model.x, model.y - 2);
            // You can edit the last two arguments according to what you need
        }
    });
}
Следует за результатом приведенного выше кода, который вы можете найти на jsFiddle:
В документации js диаграммы вы можете запускать функции после завершения анимации, используя onAnimationComplete : function(){}
Определена скрипка
Ваш HTML- файл, возможно, так
<canvas id="my_chart"></canvas>
Тогда ваш файл js может выглядеть так
fillColor: "#79D1CF",
            strokeColor: "#79D1CF",
            data: [60, 80, 81, 56, 55, 40]


 var ctx = document.getElementById("myChart1").getContext("2d");
    var myLine = new Chart(ctx).Line(chartData, {
    showTooltips: false,
    onAnimationComplete: function () {
         //Your other ChartJs features defined here


var ctx = this.chart.ctx;
        ctx.font = //your font
        ctx.fillStyle = //your text color
        ctx.textAlign = "center";
        ctx.textBaseline = "bottom";

        this.datasets.forEach(function (dataset) {
            dataset.points.forEach(function (points) {
                ctx.fillText(points.value, points.x, points.y - 10);//You can change the x and y position of the text as per your requirement
            });
        })
    }
});
// Полная атрибуция идет potatopeelings и ветке