Кумулятивная гистограмма с ggplot2
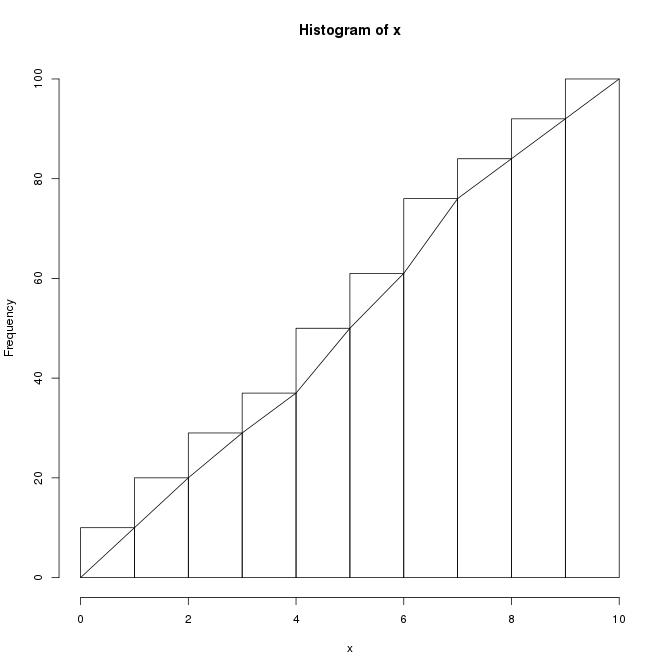
Как я могу получить кумулятивную гистограмму, как это
x <- runif(100,0,10)
h <- hist(x)
h[["counts"]] <- cumsum(h[["counts"]])
plot(h)
с ggplot2?
Я хочу также нарисовать многоугольник, как это
lines(h[["breaks"]],c(0,h[["counts"]]))
2 ответа
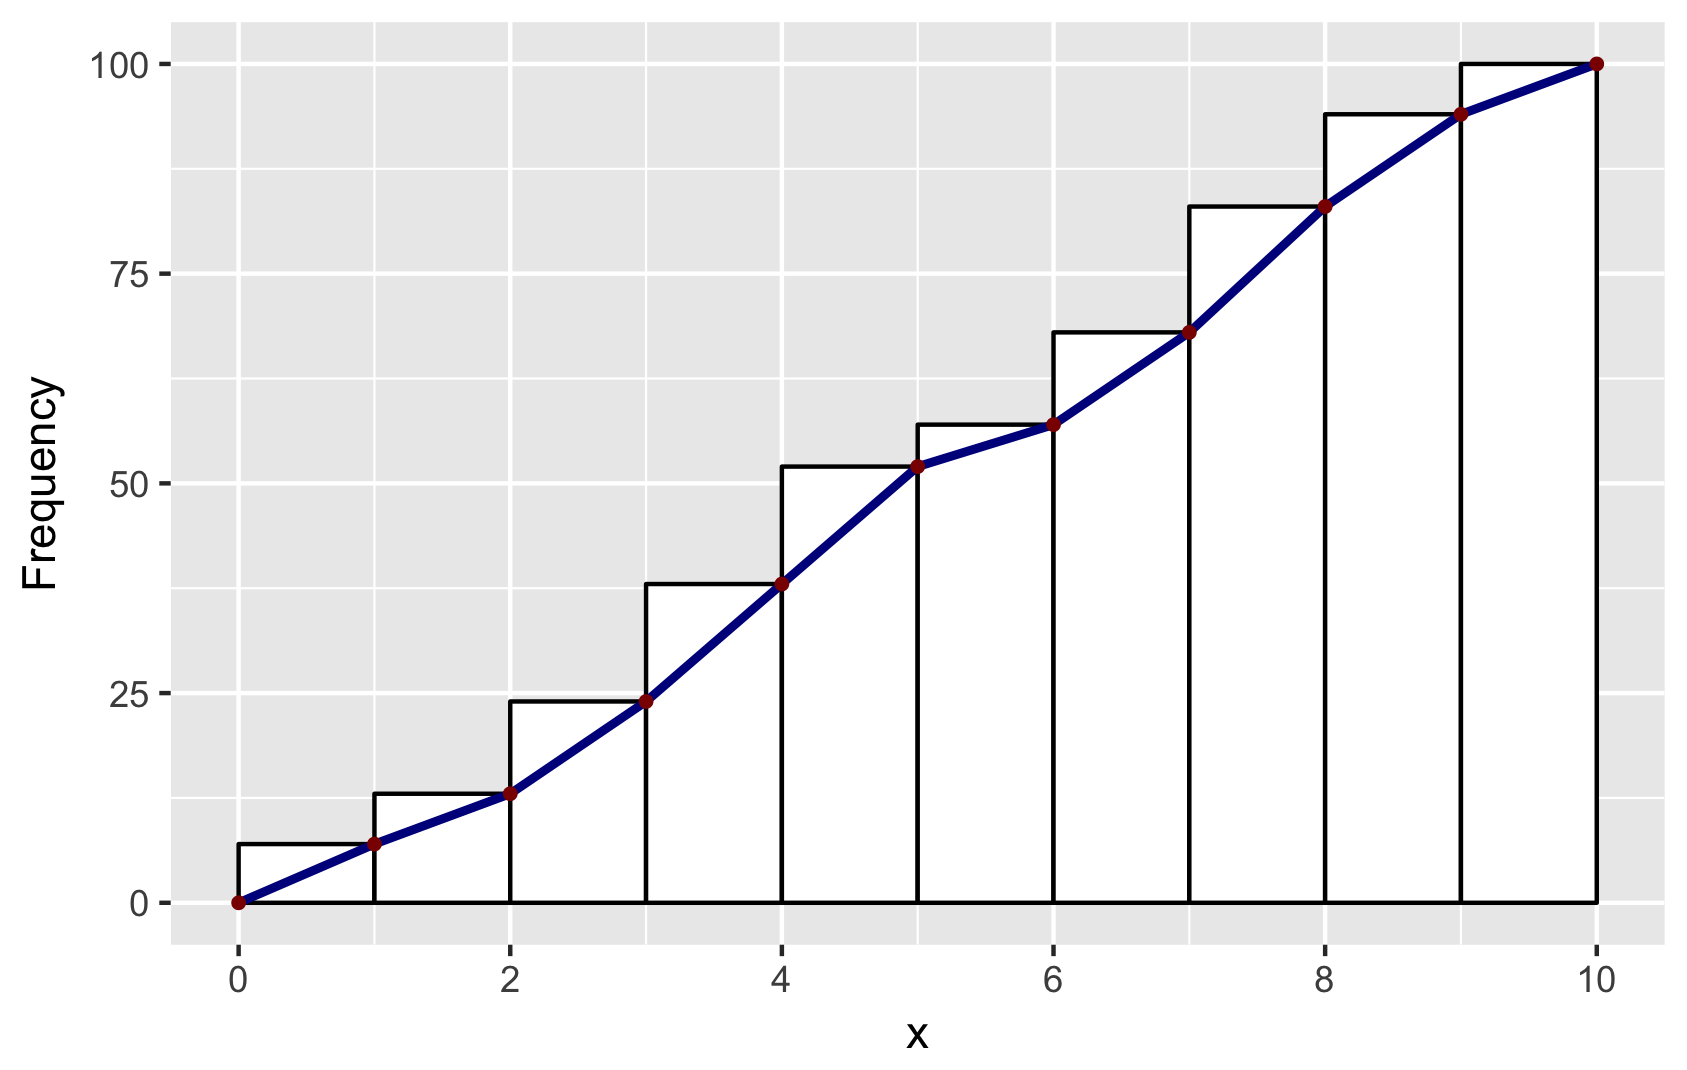
Опираясь на ответ Дидзиса, вот способ получить ggplot2 (автор: хэдли) данные в geom_line воспроизвести внешний вид base R hist,
Краткое объяснение: чтобы ящики были расположены так же, как база R, я установил binwidth=1 а также boundary=0, Чтобы получить похожий вид, я использовал color=black а также fill=white, И чтобы получить ту же позицию отрезков, я использовал ggplot_build, Вы найдете другие ответы Дидзиса, которые используют этот трюк.
# make a dataframe for ggplot
set.seed(1)
x = runif(100, 0, 10)
y = cumsum(x)
df <- data.frame(x = sort(x), y = y)

# make geom_histogram
p <- ggplot(data = df, aes(x = x)) +
    geom_histogram(aes(y = cumsum(..count..)), binwidth = 1, boundary = 0,
                color = "black", fill = "white")

# extract ggplot data
d <- ggplot_build(p)$data[[1]]

# make a data.frame for geom_line and geom_point
# add (0,0) to mimick base-R plots
df2 <- data.frame(x = c(0, d$xmax), y = c(0, d$y))

# combine plots: note that geom_line and geom_point use the new data in df2
p + geom_line(data = df2, aes(x = x, y = y),
        color = "darkblue", size = 1) +
    geom_point(data = df2, aes(x = x, y = y),
        color = "darkred", size = 1) +
    ylab("Frequency") +
    scale_x_continuous(breaks = seq(0, 10, 2))

# save for posterity
ggsave("ggplot-histogram-cumulative-2.png")
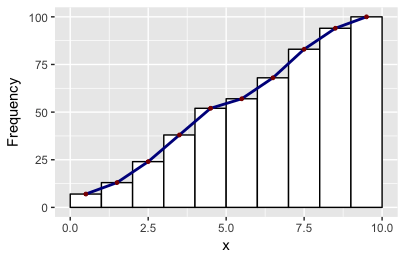
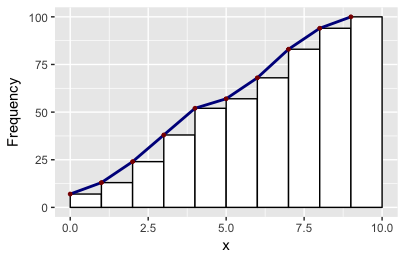
Там могут быть более простые способы против вас! Как это происходит, объект ggplot также хранит два других значения x: минимум и максимум. Таким образом, вы можете создавать другие полигоны с помощью этой удобной функции:
# Make polygons: takes a plot object, returns a data.frame
get_hist <- function(p, pos = 2) {
    d <- ggplot_build(p)$data[[1]]
    if (pos == 1) { x = d$xmin; y = d$y; }
    if (pos == 2) { x = d$x; y = d$y; }
    if (pos == 3) { x = c(0, d$xmax); y = c(0, d$y); }
    data.frame(x = x, y = y)
}
df2 = get_hist(p, pos = 3)  # play around with pos=1, pos=2, pos=3
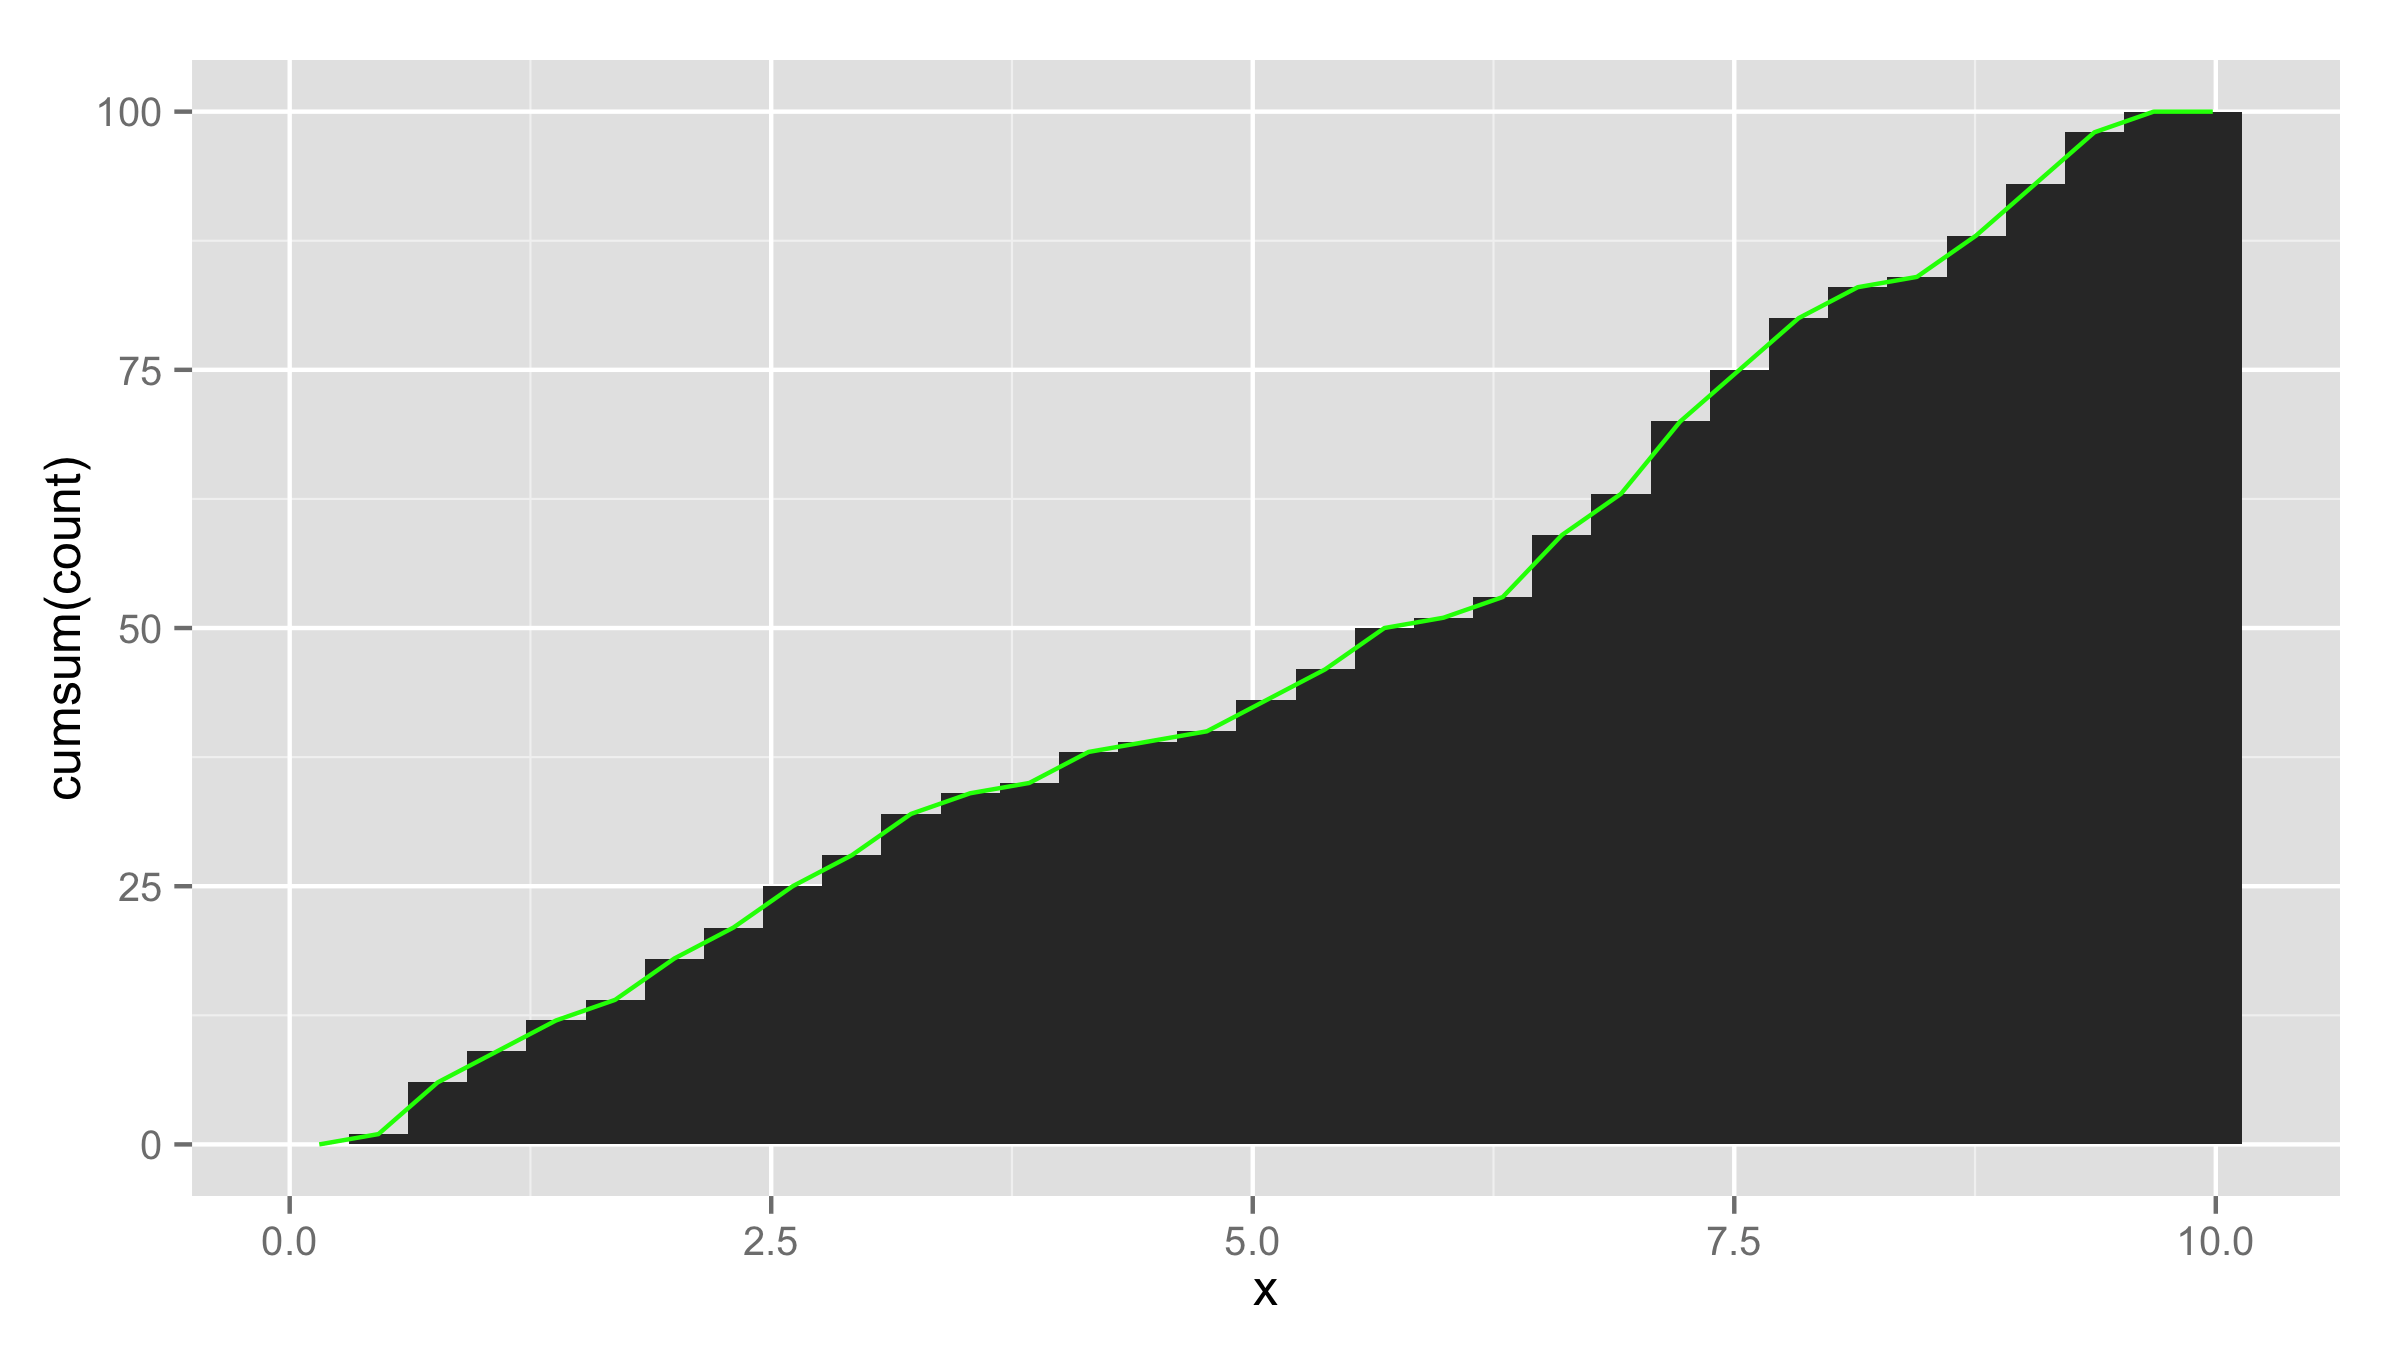
Чтобы использовать накопительную гистограмму geom_histogram() а затем использовать cumsum(..count..) за y ценности. Накопительная линия может быть добавлена с stat_bin() а также geom="line" а также y значения рассчитаны как cumsum(..count..),
ggplot(NULL,aes(x))+geom_histogram(aes(y=cumsum(..count..)))+
       stat_bin(aes(y=cumsum(..count..)),geom="line",color="green")
