Как показывать directlabels после geom_smooth, а не после geom_line?
Я использую directlabels, чтобы аннотировать мой сюжет. Как вы можете видеть на этой картинке, метки идут после geom_line, но я хочу их после geom_smooth. Это поддерживается directlabels? Или есть другие идеи, как этого добиться? Заранее спасибо!
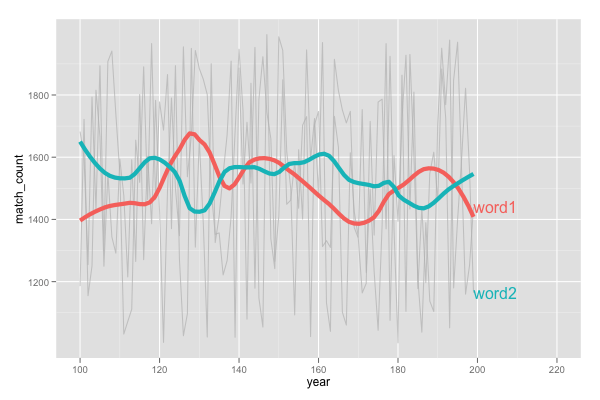
Это мой код:
library("ggplot2")
set.seed(124234345)

# Generate data
df.2 <- data.frame("n_gram" = c("word1"),
                   "year" = rep(100:199),
                   "match_count" = runif(100 ,min = 1000 , max = 2000))

df.2 <- rbind(df.2, data.frame("n_gram" = c("word2"),
                      "year" = rep(100:199),
                      "match_count" = runif(100 ,min = 1000 , max = 2000)) )

# plot
ggplot(df.2, aes(year, match_count, group=n_gram, color=n_gram)) +
  geom_line(alpha = I(7/10), color="grey", show_guide=F) +
  stat_smooth(size=2, span=0.3, se=F, show_guide=F) +
  geom_dl(aes(label=n_gram), method = "last.bumpup", show_guide=F) +
  xlim(c(100,220))
3 ответа
Я собираюсь ответить на свой вопрос здесь, так как я понял это благодаря ответу от Тайлера Ринкера.
Вот как я решил это с помощью loess(), чтобы получить позиции меток.
 # Function to get last Y-value from loess
funcDlMove <- function (n_gram) {

  model <- loess(match_count ~ year, df.2[df.2$n_gram==n_gram,], span=0.3)
  Y <- model$fitted[length(model$fitted)]
  Y <- dl.move(n_gram, y=Y,x=200)
  return(Y)
}

index <- unique(df.2$n_gram)
mymethod <- list(
  "top.points",
  lapply(index, funcDlMove)
  )

# Plot

PLOT <- ggplot(df.2, aes(year, match_count, group=n_gram, color=n_gram)) +
  geom_line(alpha = I(7/10), color="grey", show_guide=F) +
  stat_smooth(size=2, span=0.3, se=F, show_guide=F)

direct.label(PLOT, mymethod)
Который будет генерировать этот сюжет: 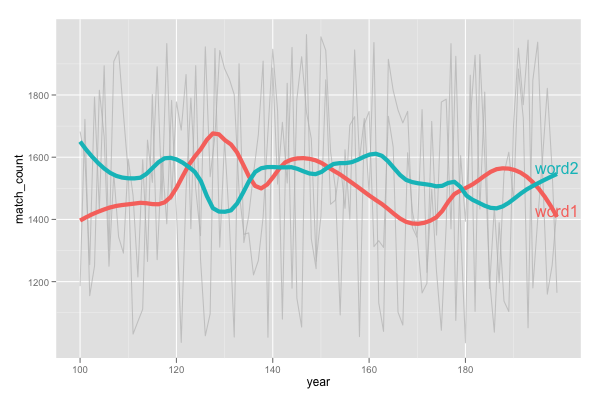
Этот ответ использует базовую концепцию ответа @celt-Ail, и вместо функции, базы R и прямой метки пытается использовать подход tidyverse, крадя отсюда некоторый код для несколькихloess модели.
Рад слышать предлагаемые улучшения.
set.seed(124234345)

# Generate data
df.2 <- data.frame("n_gram" = c("word1"),
                   "year" = rep(100:199),
                   "match_count" = runif(100 ,min = 1000 , max = 2000))

df.2 <- rbind(df.2, data.frame("n_gram" = c("word2"),
                               "year" = rep(100:199),
                               "match_count" = runif(100 ,min = 1000 , max = 2000)) )

#example of loess for multiple models
#https://stackru.com/a/55127487/4927395
library(dplyr)
library(tidyr)
library(purrr)
library(ggplot2)

models <- df.2 %>%
  tidyr::nest(-n_gram) %>%
  dplyr::mutate(
    # Perform loess calculation on each CpG group
    m = purrr::map(data, loess,
                   formula = match_count ~ year, span = .3),
    # Retrieve the fitted values from each model
    fitted = purrr::map(m, `[[`, "fitted")
  )

# Apply fitted y's as a new column
results <- models %>%
  dplyr::select(-m) %>%
  tidyr::unnest()

#find final x values for each group
my_last_points <- results %>% group_by(n_gram) %>% summarise(year = max(year, na.rm=TRUE))

#Join dataframe of predictions to group labels
my_last_points$pred_y <- left_join(my_last_points, results)

# Plot with loess line for each group
ggplot(results, aes(x = year, y = match_count, group = n_gram, colour = n_gram)) +
  geom_line(alpha = I(7/10), color="grey", show.legend=F) +
  #stat_smooth(size=2, span=0.3, se=F, show_guide=F)
  geom_point() +
  geom_line(aes(y = fitted))+
  geom_text(data = my_last_points, aes(x=year+5, y=pred_y$fitted, label = n_gram))
# use stat smooth with geom_dl to get matching direct labels.
span <- 0.3
ggplot(df.2, aes(year, match_count, group=n_gram, color=n_gram)) +
  geom_line(alpha = I(7/10), color="grey") +
  stat_smooth(size=2, span=span, se=F) +
  geom_dl(aes(label=n_gram), method = "last.qp", stat="smooth", span=span) +
  xlim(c(100,220))+
  guides(colour="none")
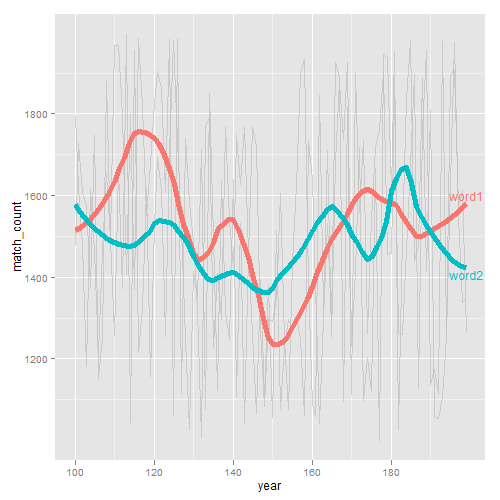
Это не то, что вы просили, так как я не знаю, как это сделать, но это может быть более полезным для вас, так как вы потеряете меньше площади печати для меток:
PLOT <- ggplot(df.2, aes(year, match_count, group=n_gram, color=n_gram)) +
  geom_line(alpha = I(7/10), color="grey", show_guide=F) +
  stat_smooth(size=2, span=0.3, se=F, show_guide=F)

mymethod <- list(
    "top.points",
    dl.move("word1", hjust=-6.65, vjust=13),
    dl.move("word2", hjust =-7.9, vjust=20.25)
)

direct.label(PLOT, mymethod)
который дает:
Вы также можете попробовать:
mymethod <- list(
    "top.points",
    dl.move("word1", hjust=-6, vjust=14),
    dl.move("word2", hjust =-7.1, vjust=19.5)
)

ggplot(df.2, aes(year, match_count, group=n_gram, color=n_gram)) +
  geom_line(alpha = I(7/10), color="grey", show_guide=F) +
  xlim(c(100,220))+
  stat_smooth(size=2, span=0.3, se=F, show_guide=F) +
  geom_dl(aes(label=n_gram), method = mymethod, show_guide=F)
который дает:

ПРИМЕЧАНИЕ. Чтобы печатать на других графических устройствах (это был Windows rgui), вам необходимо настроить параметры и настройки в соответствии с требованиями. Но если есть более прямой путь, это было бы лучше.