Роза ветров с ggplot (R)?
Я ищу хороший код R (или пакет), который использует ggplot2 для создания роз ветров, которые показывают частоту, величину и направление ветра.
Я особенно заинтересован в ggplot2, так как построение сюжета таким образом дает мне возможность использовать остальную часть функциональности.
Тестовые данные
Загрузите данные о погоде за год с 80-метрового уровня на башне M2 Национальной ветровой техники. Эта ссылка создаст файл.csv, который будет автоматически загружен. Вам нужно найти этот файл (он называется "20130101.csv") и прочитать его в.
# read in a data file
data.in <- read.csv(file = "A:/drive/somehwere/20130101.csv",
                    col.names = c("date","hr","ws.80","wd.80"),
                    stringsAsFactors = FALSE))
Это будет работать с любым файлом.csv и будет перезаписывать имена столбцов.
Пример данных
Если вы не хотите загружать эти данные, вот 10 точек данных, которые мы будем использовать для демонстрации процесса:
data.in <- structure(list(date = structure(c(1L, 1L, 1L, 1L, 1L, 1L, 1L,
1L, 1L),.Label = "01.01.2013", class = "factor"), hr = 1:9, ws.80 = c(5, 7, 7, 51,9, 11, 12, 9, 11, 17), wd.80 = c(30, 30, 30, 180, 180, 180, 269, 270, 271)), .Names = c("date", "hr", "ws.80", "wd.80"), row.names = c(NA, -9L), class = "data.frame")
3 ответа
Ради аргумента мы предположим, что мы используем data.in фрейм данных, который имеет два столбца данных и некоторую информацию о дате / времени. Сначала мы будем игнорировать информацию о дате и времени.
Функция ggplot
Я кодировал функцию ниже. Я заинтересован в опыте других людей или предложениях по улучшению этого.
# WindRose.R
require(ggplot2)
require(RColorBrewer)

plot.windrose <- function(data,
                      spd,
                      dir,
                      spdres = 2,
                      dirres = 30,
                      spdmin = 2,
                      spdmax = 20,
                      spdseq = NULL,
                      palette = "YlGnBu",
                      countmax = NA,
                      debug = 0){


# Look to see what data was passed in to the function
  if (is.numeric(spd) & is.numeric(dir)){
    # assume that we've been given vectors of the speed and direction vectors
    data <- data.frame(spd = spd,
                       dir = dir)
    spd = "spd"
    dir = "dir"
  } else if (exists("data")){
    # Assume that we've been given a data frame, and the name of the speed
    # and direction columns. This is the format we want for later use.
  }

  # Tidy up input data ----
  n.in <- NROW(data)
  dnu <- (is.na(data[[spd]]) | is.na(data[[dir]]))
  data[[spd]][dnu] <- NA
  data[[dir]][dnu] <- NA

  # figure out the wind speed bins ----
  if (missing(spdseq)){
    spdseq <- seq(spdmin,spdmax,spdres)
  } else {
    if (debug >0){
      cat("Using custom speed bins \n")
    }
  }
  # get some information about the number of bins, etc.
  n.spd.seq <- length(spdseq)
  n.colors.in.range <- n.spd.seq - 1

  # create the color map
  spd.colors <- colorRampPalette(brewer.pal(min(max(3,
                                                    n.colors.in.range),
                                                min(9,
                                                    n.colors.in.range)),
                                            palette))(n.colors.in.range)

  if (max(data[[spd]],na.rm = TRUE) > spdmax){
    spd.breaks <- c(spdseq,
                    max(data[[spd]],na.rm = TRUE))
    spd.labels <- c(paste(c(spdseq[1:n.spd.seq-1]),
                          '-',
                          c(spdseq[2:n.spd.seq])),
                    paste(spdmax,
                          "-",
                          max(data[[spd]],na.rm = TRUE)))
    spd.colors <- c(spd.colors, "grey50")
  } else{
    spd.breaks <- spdseq
    spd.labels <- paste(c(spdseq[1:n.spd.seq-1]),
                        '-',
                        c(spdseq[2:n.spd.seq]))
  }
  data$spd.binned <- cut(x = data[[spd]],
                         breaks = spd.breaks,
                         labels = spd.labels,
                         ordered_result = TRUE)
  # clean up the data
  data. <- na.omit(data)

  # figure out the wind direction bins
  dir.breaks <- c(-dirres/2,
                  seq(dirres/2, 360-dirres/2, by = dirres),
                  360+dirres/2)
  dir.labels <- c(paste(360-dirres/2,"-",dirres/2),
                  paste(seq(dirres/2, 360-3*dirres/2, by = dirres),
                        "-",
                        seq(3*dirres/2, 360-dirres/2, by = dirres)),
                  paste(360-dirres/2,"-",dirres/2))
  # assign each wind direction to a bin
  dir.binned <- cut(data[[dir]],
                    breaks = dir.breaks,
                    ordered_result = TRUE)
  levels(dir.binned) <- dir.labels
  data$dir.binned <- dir.binned

  # Run debug if required ----
  if (debug>0){
    cat(dir.breaks,"\n")
    cat(dir.labels,"\n")
    cat(levels(dir.binned),"\n")
  }

  # deal with change in ordering introduced somewhere around version 2.2
  if(packageVersion("ggplot2") > "2.2"){
    cat("Hadley broke my code\n")
    data$spd.binned = with(data, factor(spd.binned, levels = rev(levels(spd.binned))))
    spd.colors = rev(spd.colors)
  }

  # create the plot ----
  p.windrose <- ggplot(data = data,
                       aes(x = dir.binned,
                           fill = spd.binned)) +
    geom_bar() +
    scale_x_discrete(drop = FALSE,
                     labels = waiver()) +
    coord_polar(start = -((dirres/2)/360) * 2*pi) +
    scale_fill_manual(name = "Wind Speed (m/s)",
                      values = spd.colors,
                      drop = FALSE) +
    theme(axis.title.x = element_blank())

  # adjust axes if required
  if (!is.na(countmax)){
    p.windrose <- p.windrose +
      ylim(c(0,countmax))
  }

  # print the plot
  print(p.windrose)

  # return the handle to the wind rose
  return(p.windrose)
}
Доказательство концепции и логики
Теперь мы проверим, что код выполняет то, что мы ожидаем. Для этого мы будем использовать простой набор демонстрационных данных.
# try the default settings
p0 <- plot.windrose(spd = data.in$ws.80,
                   dir = data.in$wd.80)
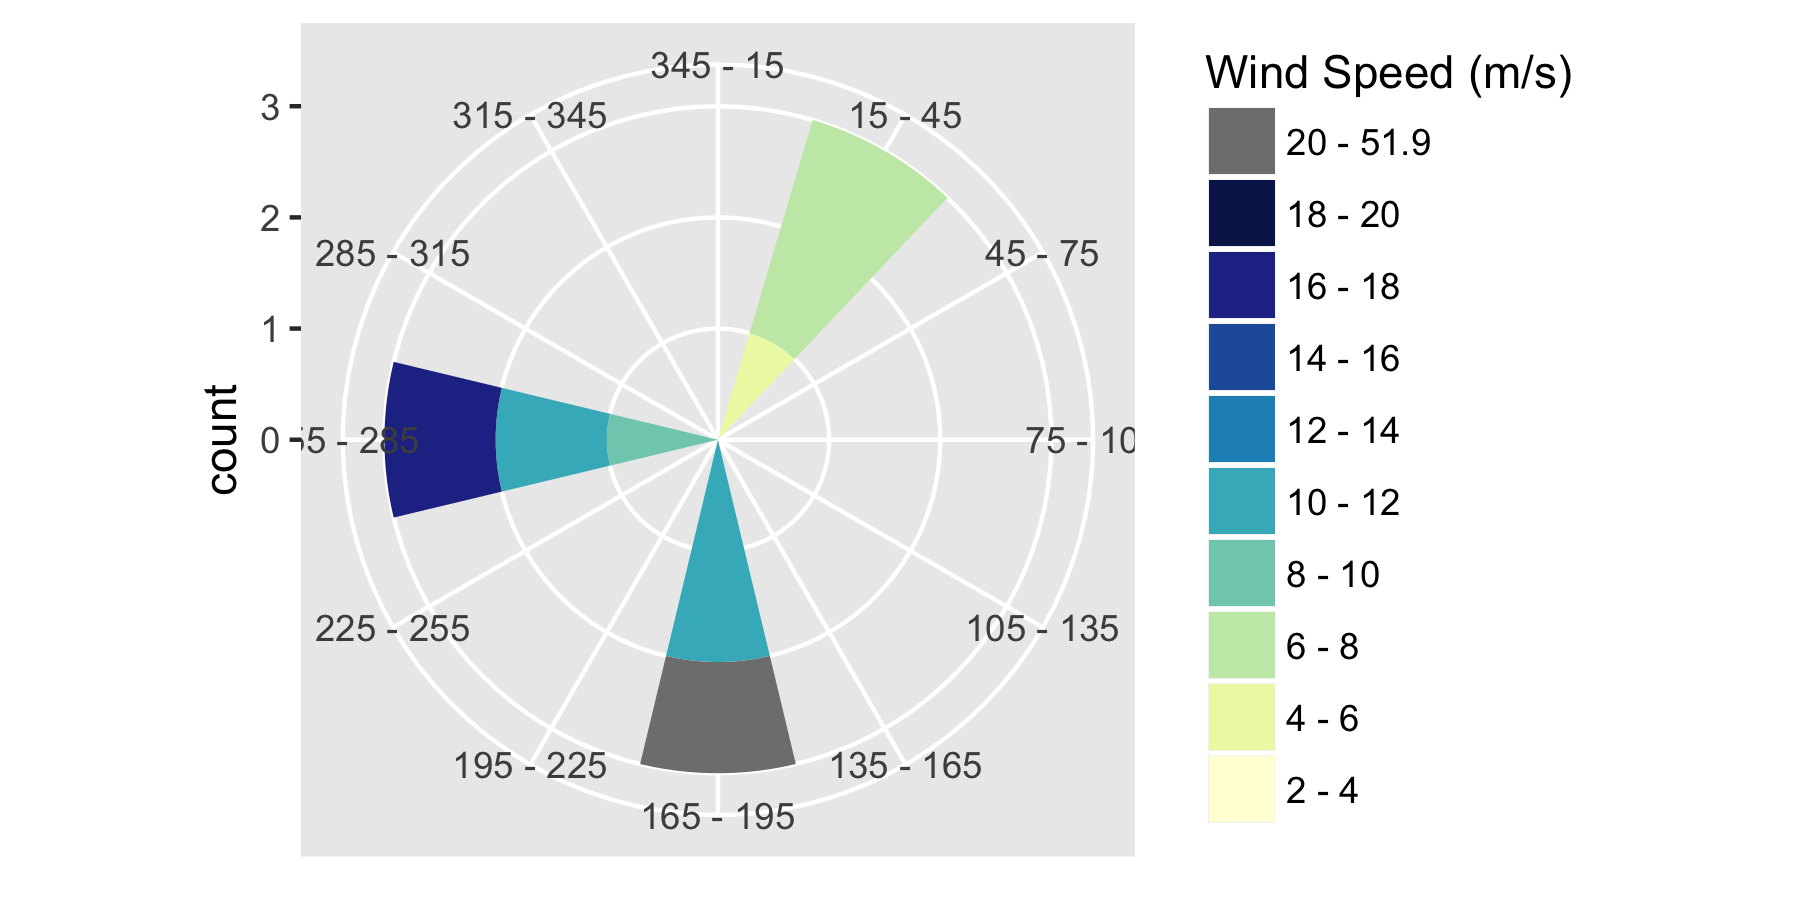
Это дает нам этот сюжет:  Итак: мы правильно связали данные по направлению и скорости ветра и закодировали наши данные вне диапазона, как и ожидалось. Выглядит хорошо!
Используя эту функцию
Теперь мы загружаем реальные данные. Мы можем загрузить это с URL:
data.in <- read.csv(file = "http://midcdmz.nrel.gov/apps/plot.pl?site=NWTC&start=20010824&edy=26&emo=3&eyr=2062&year=2013&month=1&day=1&endyear=2013&endmonth=12&endday=31&time=0&inst=21&inst=39&type=data&wrlevel=2&preset=0&first=3&math=0&second=-1&value=0.0&user=0&axis=1",
                    col.names = c("date","hr","ws.80","wd.80"))
или из файла:
data.in <- read.csv(file = "A:/blah/20130101.csv",
                    col.names = c("date","hr","ws.80","wd.80"))
Быстрый способ
Простой способ использовать это с данными M2 - просто передать отдельные векторы для spd а также dir (скорость и направление):
# try the default settings
p1 <- plot.windrose(spd = data.in$ws.80,
                   dir = data.in$wd.80)
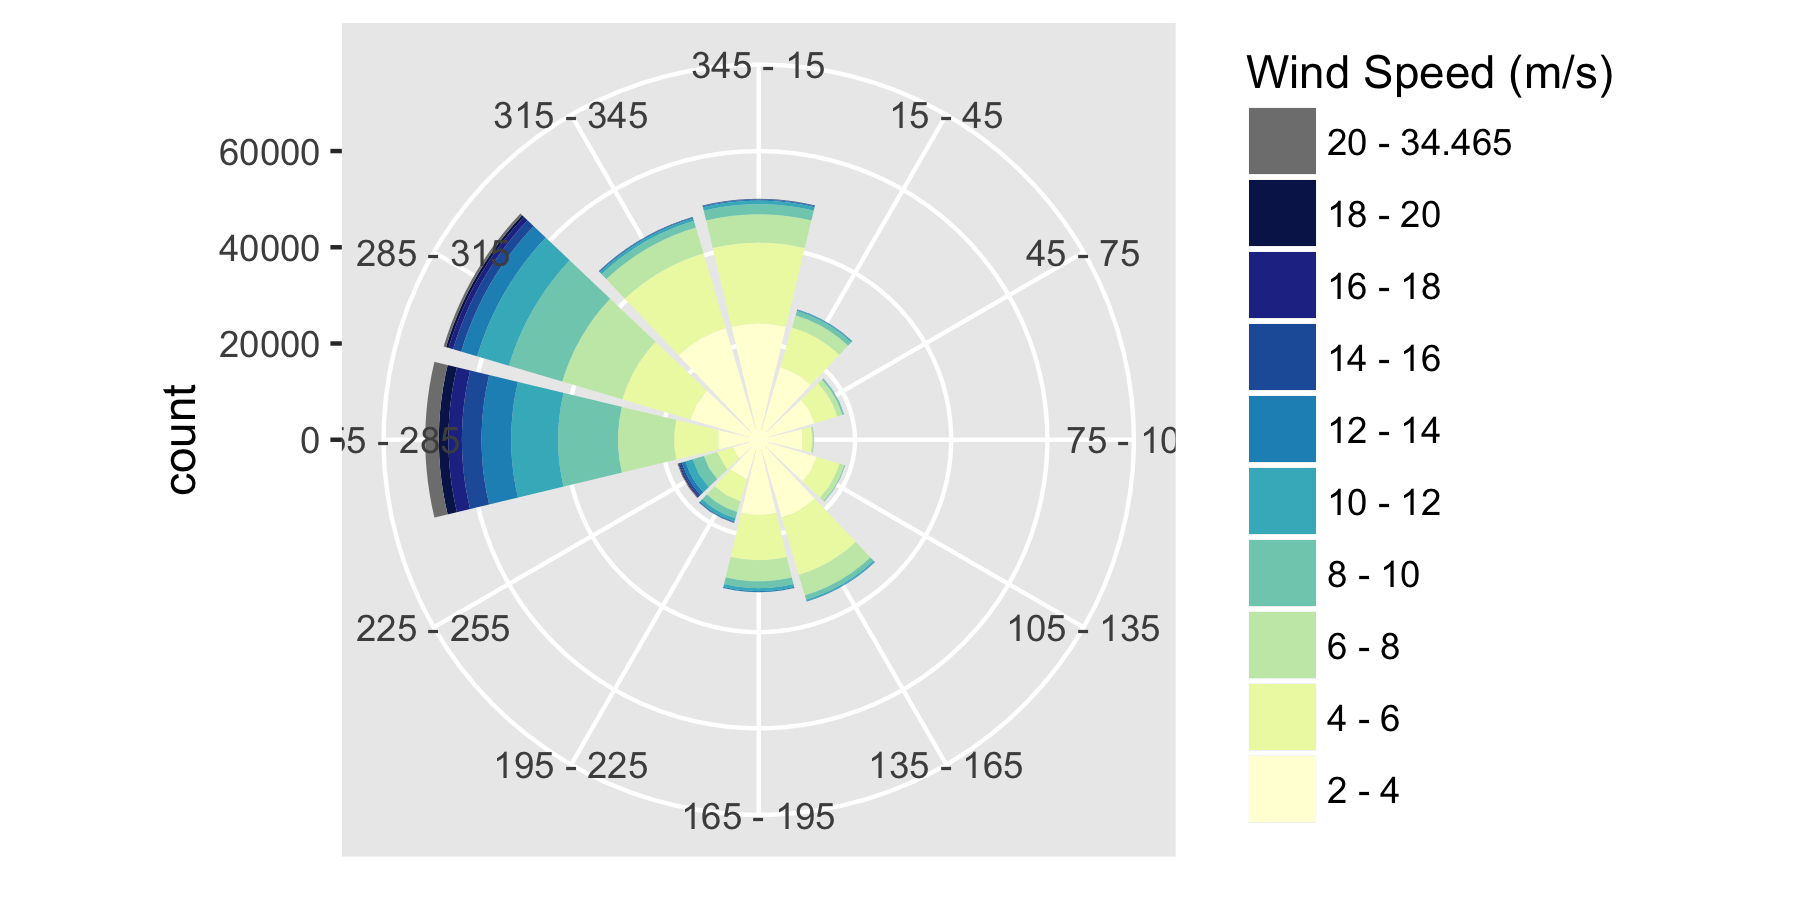
Что дает нам этот сюжет:
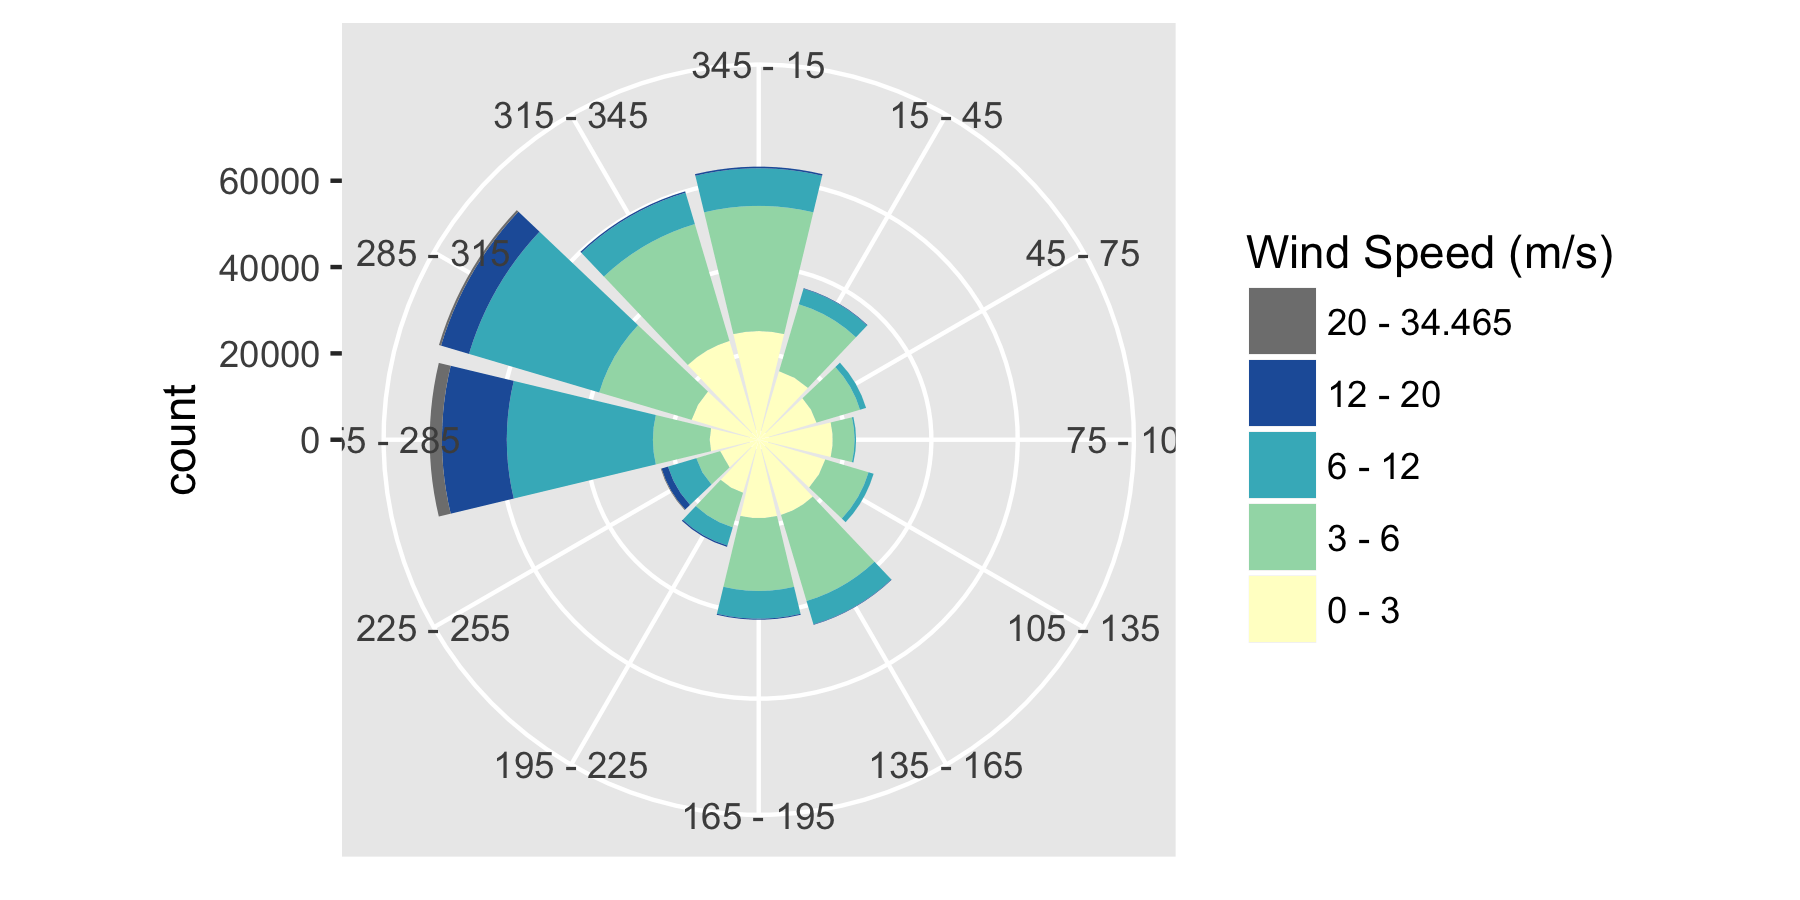
И если мы хотим, чтобы пользовательские корзины были добавлены в качестве аргументов:
p2 <- plot.windrose(spd = data.in$ws.80,
                   dir = data.in$wd.80,
                   spdseq = c(0,3,6,12,20))
Использование фрейма данных и имен столбцов
Чтобы сделать участки более совместимыми с ggplot()Вы также можете передать фрейм данных и имя переменных скорости и направления:
p.wr2 <- plot.windrose(data = data.in,
              spd = "ws.80",
              dir = "wd.80")
Гранение другой переменной
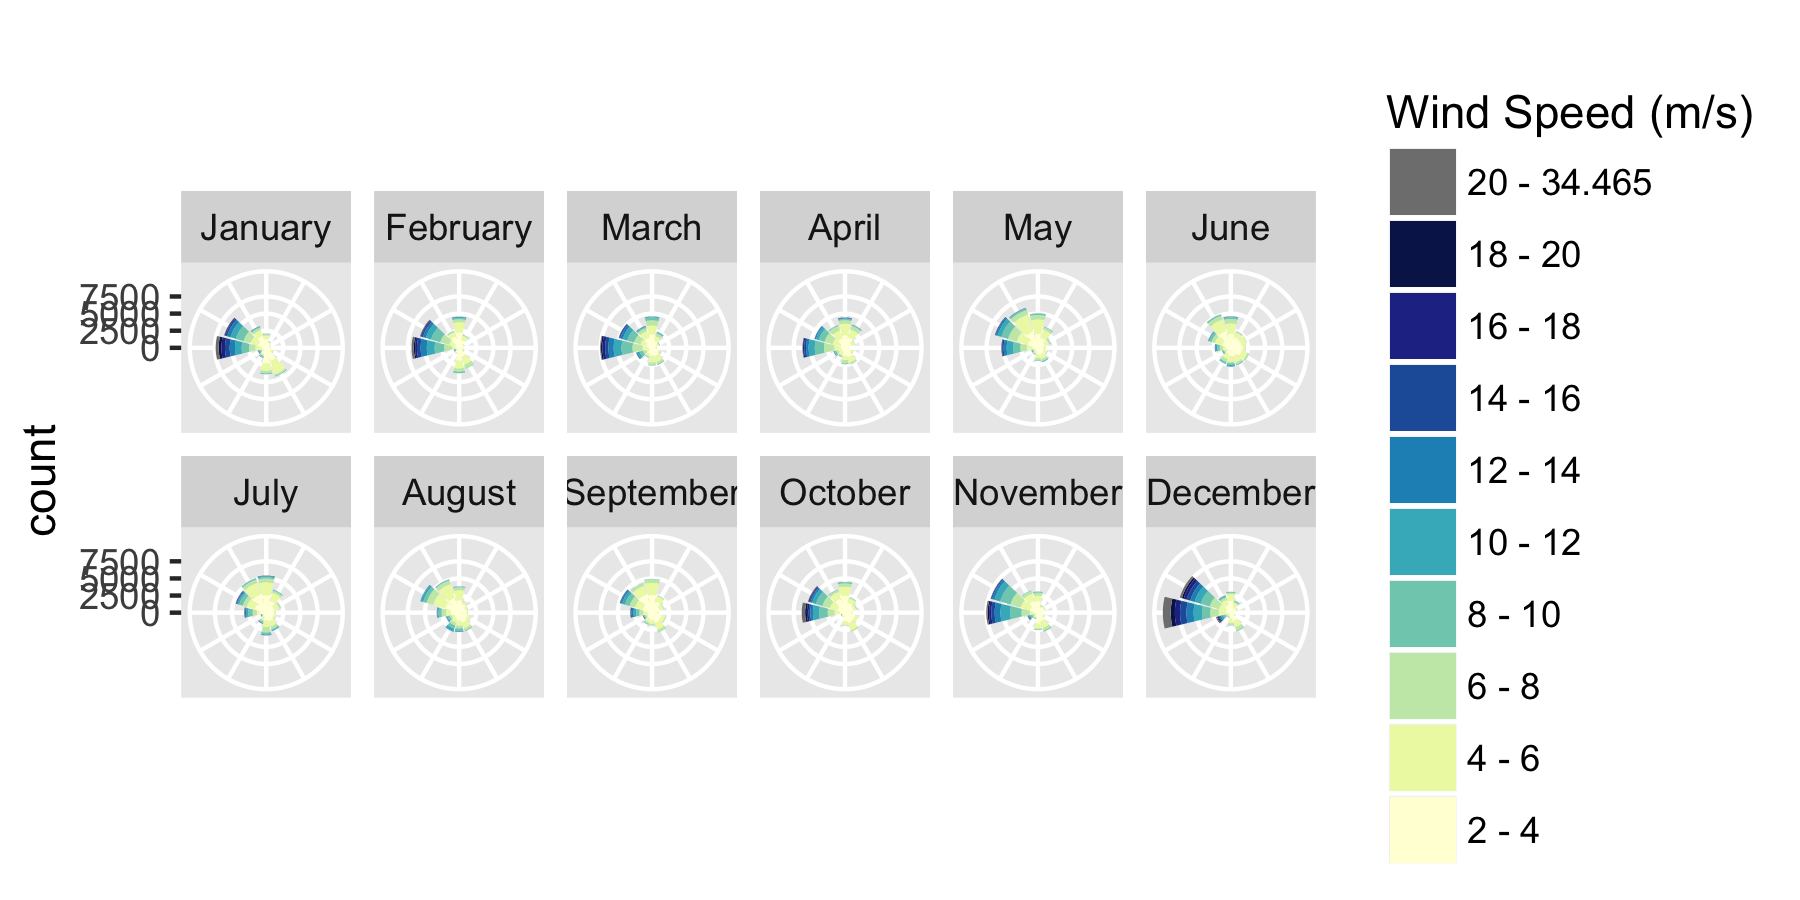
Мы также можем построить данные по месяцам или годам, используя возможности граней ggplot. Давайте начнем с получения метки времени из информации о дате и часах в data.inи преобразование в месяц и год:
# first create a true POSIXCT timestamp from the date and hour columns
data.in$timestamp <- as.POSIXct(paste0(data.in$date, " ", data.in$hr),
                                tz = "GMT",
                                format = "%m/%d/%Y %H:%M")

# Convert the time stamp to years and months
data.in$Year <- as.numeric(format(data.in$timestamp, "%Y"))
data.in$month <- factor(format(data.in$timestamp, "%B"),
                        levels = month.name)
Затем вы можете применить огранку, чтобы показать, как роза ветров меняется в зависимости от месяца:
# recreate p.wr2, so that includes the new data
p.wr2 <- plot.windrose(data = data.in,
              spd = "ws.80",
              dir = "wd.80")
# now generate the faceting
p.wr3 <- p.wr2 + facet_wrap(~month,
                            ncol = 3)
# and remove labels for clarity
p.wr3 <- p.wr3 + theme(axis.text.x = element_blank(),
          axis.title.x = element_blank())
Комментарии
Несколько замечаний о функции и о том, как ее можно использовать:
- Входы:
- векторы скорости (
spd) и направление (dir) или имя фрейма данных и имена столбцов, которые содержат данные о скорости и направлении. - необязательные значения размера бункера для скорости ветра (
spdres) и направление (dirres). paletteэто имя последовательной палитры цветоводов,countmaxустанавливает диапазон розы ветров.debugэто переключатель (0,1,2) для включения различных уровней отладки.
- векторы скорости (
- Я хотел иметь возможность установить максимальную скорость (
spdmax) и количество (countmax) для графиков, чтобы я мог сравнить роза ветров из разных наборов данных - Если есть скорости ветра, которые превышают (
spdmax), они добавляются в виде серой области (см. рисунок). Я, наверное, должен написать что-то вродеspdminа также регионы с цветовым кодом, где скорости ветра меньше. - Следуя запросу, я реализовал метод для использования пользовательских корзин скорости ветра. Они могут быть добавлены с помощью
spdseq = c(1,3,5,12)аргумент. - Вы можете удалить метки бина степени, используя обычные команды ggplot, чтобы очистить ось x:
p.wr3 + theme(axis.text.x = element_blank(),axis.title.x = element_blank()), - В какой-то момент недавно ggplot2 изменил порядок бинов, так что графики не работали. Я думаю, что это была версия 2.2. Но если ваши графики выглядят немного странно, измените код так, чтобы тест для "2.2" был, возможно, "2.1" или "2.0".
Вот моя версия кода. Я добавил метки для направлений (N, NNE, NE, ENE, E....) и сделал метку y для отображения частоты в процентах вместо числа.
Нажмите здесь, чтобы увидеть фигуру розы ветров с направлениями и частотой (%)
    # WindRose.R
require(ggplot2)
require(RColorBrewer)
require(scales)

plot.windrose <- function(data,
                          spd,
                          dir,
                          spdres = 2,
                          dirres = 22.5,
                          spdmin = 2,
                          spdmax = 20,
                          spdseq = NULL,
                          palette = "YlGnBu",
                          countmax = NA,
                          debug = 0){


  # Look to see what data was passed in to the function
  if (is.numeric(spd) & is.numeric(dir)){
    # assume that we've been given vectors of the speed and direction vectors
    data <- data.frame(spd = spd,
                       dir = dir)
    spd = "spd"
    dir = "dir"
  } else if (exists("data")){
    # Assume that we've been given a data frame, and the name of the speed
    # and direction columns. This is the format we want for later use.
  }

  # Tidy up input data ----
  n.in <- NROW(data)
  dnu <- (is.na(data[[spd]]) | is.na(data[[dir]]))
  data[[spd]][dnu] <- NA
  data[[dir]][dnu] <- NA

  # figure out the wind speed bins ----
  if (missing(spdseq)){
    spdseq <- seq(spdmin,spdmax,spdres)
  } else {
    if (debug >0){
      cat("Using custom speed bins \n")
    }
  }
  # get some information about the number of bins, etc.
  n.spd.seq <- length(spdseq)
  n.colors.in.range <- n.spd.seq - 1

  # create the color map
  spd.colors <- colorRampPalette(brewer.pal(min(max(3,
                                                    n.colors.in.range),
                                                min(9,
                                                    n.colors.in.range)),
                                            palette))(n.colors.in.range)

  if (max(data[[spd]],na.rm = TRUE) > spdmax){
    spd.breaks <- c(spdseq,
                    max(data[[spd]],na.rm = TRUE))
    spd.labels <- c(paste(c(spdseq[1:n.spd.seq-1]),
                          '-',
                          c(spdseq[2:n.spd.seq])),
                    paste(spdmax,
                          "-",
                          max(data[[spd]],na.rm = TRUE)))
    spd.colors <- c(spd.colors, "grey50")
  } else{
    spd.breaks <- spdseq
    spd.labels <- paste(c(spdseq[1:n.spd.seq-1]),
                        '-',
                        c(spdseq[2:n.spd.seq]))
  }
  data$spd.binned <- cut(x = data[[spd]],
                         breaks = spd.breaks,
                         labels = spd.labels,
                         ordered_result = TRUE)

  # figure out the wind direction bins
  dir.breaks <- c(-dirres/2,
                  seq(dirres/2, 360-dirres/2, by = dirres),
                  360+dirres/2)
  dir.labels <- c(paste(360-dirres/2,"-",dirres/2),
                  paste(seq(dirres/2, 360-3*dirres/2, by = dirres),
                        "-",
                        seq(3*dirres/2, 360-dirres/2, by = dirres)),
                  paste(360-dirres/2,"-",dirres/2))
  # assign each wind direction to a bin
  dir.binned <- cut(data[[dir]],
                    breaks = dir.breaks,
                    ordered_result = TRUE)
  levels(dir.binned) <- dir.labels
  data$dir.binned <- dir.binned

  # Run debug if required ----
  if (debug>0){
    cat(dir.breaks,"\n")
    cat(dir.labels,"\n")
    cat(levels(dir.binned),"\n")

  }

  # create the plot ----
  p.windrose <- ggplot(data = data,
                       aes(x = dir.binned,
                           fill = spd.binned
                           ,y = (..count..)/sum(..count..)
                           ))+
    geom_bar() +
    scale_x_discrete(drop = FALSE,
                     labels = c("N","NNE","NE","ENE", "E",
                                "ESE", "SE","SSE",
                                "S","SSW", "SW","WSW", "W",
                                "WNW","NW","NNW")) +
    coord_polar(start = -((dirres/2)/360) * 2*pi) +
    scale_fill_manual(name = "Wind Speed (m/s)",
                      values = spd.colors,
                      drop = FALSE) +
    theme(axis.title.x = element_blank()) +
    scale_y_continuous(labels = percent) +
    ylab("Frequencia")

  # adjust axes if required
  if (!is.na(countmax)){
    p.windrose <- p.windrose +
      ylim(c(0,countmax))
  }

  # print the plot
  print(p.windrose)

  # return the handle to the wind rose
  return(p.windrose)
}
Вы когда-нибудь пробовали использовать функцию windRose из пакета Openair? Это очень просто, и вы можете установить интервалы, статистику и т. Д.
windRose(mydata, ws = "ws", wd = "wd", ws2 = NA, wd2 = NA,
  ws.int = 2, angle = 30, type = "default", bias.corr = TRUE, cols
  = "default", grid.line = NULL, width = 1, seg = NULL, auto.text
  = TRUE, breaks = 4, offset = 10, normalise = FALSE, max.freq =
  NULL, paddle = TRUE, key.header = NULL, key.footer = "(m/s)",
  key.position = "bottom", key = TRUE, dig.lab = 5, statistic =
  "prop.count", pollutant = NULL, annotate = TRUE, angle.scale =
  315, border = NA, ...)


  pollutionRose(mydata, pollutant = "nox", key.footer = pollutant,
  key.position = "right", key = TRUE, breaks = 6, paddle = FALSE,
  seg = 0.9, normalise = FALSE, ...)


