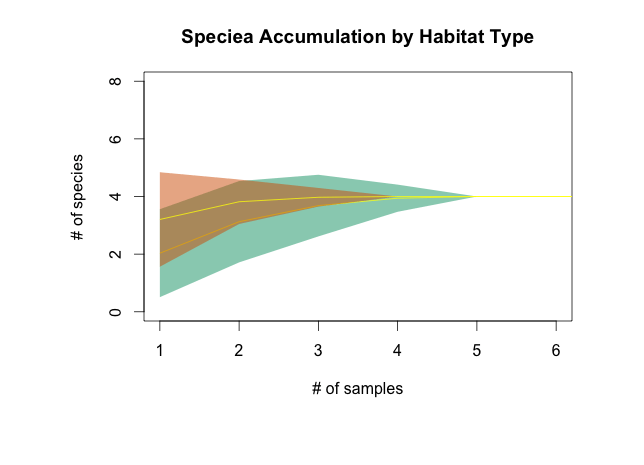
Прозрачность цвета многоугольника с использованием графика и палитры дальтоников
Я использую веганский для построения кривых накопления видов.
* Я хочу наложить их на один и тот же график * Я хочу использовать дружественные цвета для слепых цветов * Я хочу использовать прозрачность с построенными полигонами
Я могу сделать первые два из вышеперечисленного (см. Пример кода ниже), но когда я использую дружественные по цвету слепые цвета RGB (чтобы разрешить использование альфы, параметр, задающий прозрачность) вместо шестнадцатеричных цветов (которые не позволяют прозрачность), я получаю сообщение об ошибке (пример: "Ошибка в rgb(0, 158, 115, 0.5): интенсивность цвета 115, а не в [0,1]")
Я знаю, что мой код не такой элегантный, как начинающий!
Как я могу сделать это с перекрывающимися полигонами в дальтониках с контролем прозрачности?
    habitat1 = data.frame(species1=c(0,0,3,4,0,5,9),
                  species2=c(1,0,3,0,5,0,0),
                  species3=c(0,1,0,2,4,0,0),
                  species4=c(8,0,2,0,5,1,0))
    habitat2 = data.frame(species1=c(3,23,13,99,1,0,0),
                  species2=c(1,0,3,4,0,26,0),
                  species3=c(7,1,8,38,4,47,7),
                  species4=c(7,7,2,3,5,0,8))

    require(ggplot2)
    require(vegan)

    speca_hab1 <- specaccum(comm=habitat1, method="random", permutations=1000)
    speca_hab2 <- specaccum(comm=habitat2, method="random", permutations=1000)

    par(mfrow=c(1,1), mai=c(2, 2, 1, 1))

    plot.new() # telling R we are starting a new plot

    plot(speca_hab1, main="Speciea Accumulation by Habitat Type",
         xlab ="# of samples", ylab ="# of species", ci.type="polygon",
         ci.col="#CC79A7", ci.lty=0, col = "yellow", xlim = c(1, 6),
         ylim = c(0, 8)) # habitat 1 - Savanna
    plot(speca_hab2, xlab ="# of samples", ylab ="# of species",
         ci.type="polygon", ci.col="#D55E00", ci.lty=0, col="yellow",
         add=TRUE) # habitat 2 - Prairie

    # colorblind friendly colors
    # 0,0,0       #000000 # Black
    # 230,159,0   #E69F00 # Orange
    # 86,180,233  #56B4E9 # Sky Blue
    # 0,158,115   #009E73 # bluish Green
    # 240,228,66  #F0E442 # Yellow
    # 0,114,178   #0072B2 # Blue
    # 213,94,0    #D55E00 # Vermillion
    # 204,121,167 #CC79A7 # reddish Purple

    #-------------------------------------------------
    #The following does not work:

    plot.new() # telling R we are starting a new plot

    plot(speca_hab1, main="Speciea Accumulation by Habitat Type",
         xlab ="# of samples", ylab ="# of species", ci.type="polygon",
         ci.col=rgb(0,158,115,0.5), ci.lty=0, col = "yellow", xlim = c(1, 6),
         ylim = c(0, 8)) # habitat 1 - Savanna
    plot(speca_hab2, xlab ="# of samples", ylab ="# of species",
         ci.type="polygon", ci.col=rgb(213,94,0,0.5), ci.lty=0, col="yellow",
         add=TRUE) # habitat 2 - Prairie

    # color=rgb(0,0,0,alpha=0.3)  gives black with a tranparency of 30%
    # or,  rgb(0,158,115,0.5) is 50% transparency for bluish Green
1 ответ
Ваш код не работал, потому что rgb требует пропорций. Просто разделите все значения на 255.
plot.new() # telling R we are starting a new plot

plot(speca_hab1,
     main = "Speciea Accumulation by Habitat Type",
     xlab = "# of samples",
     ylab = "# of species",
     ci.type = "polygon",
     ci.col = rgb(0, 158/255, 115/255, 0.5),
     ci.lty = 0,
     col = "yellow",
     xlim = c(1, 6),
     ylim = c(0, 8)) # habitat 1 - Savanna
plot(speca_hab2,
     xlab = "# of samples",
     ylab ="# of species",
     ci.type = "polygon",
     ci.col = rgb(213/255, 94/255, 0, 0.5),
     ci.lty = 0,
     col = "yellow",
     add = TRUE) # habitat 2 - Prairie

Вот удобная обертка, которая сделает всю работу за вас!
col2alpha <- function(col, alpha) {
  col_rgb <- col2rgb(col)/255
  rgb(col_rgb[1], col_rgb[2], col_rgb[3], alpha = alpha)
}

plot(speca_hab1,
     main = "Speciea Accumulation by Habitat Type",
     xlab = "# of samples",
     ylab = "# of species",
     ci.type = "polygon",
     ci.col = col2alpha("#0072B2", 0.5),
     ci.lty = 0,
     col = "yellow",
     xlim = c(1, 6),
     ylim = c(0, 8))