Пульсирующие маркеры на карте d3.js
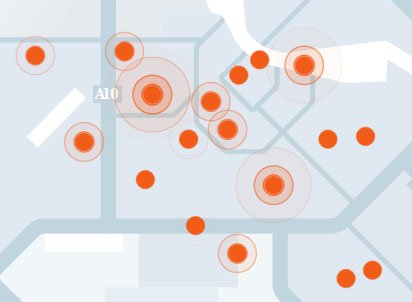
Я создаю приложение, которое будет наносить маркеры на карту - и будет плавно анимировать сигнальные кольца от маркеров.
Маркеры будут иметь следующие свойства
- размер
- координата х
- координата у
- рейтинг тревоги
если уровень сигнала тревоги низкий - я хочу, чтобы звуки пульсировали очень медленно, если его уровень пульсирует быстрее, и, возможно, выйдет дальше.
В какой-то момент это будет использоваться в приложении для знакомств, так что, например, рейтинг тревоги будет представлять людей, срочно ищущих другого человека на сегодняшний день. Хорошо, если карта попадает на текущее местоположение пользователя, а срочно звонит пользовательский звонок.
Вот последняя скрипка, http://jsfiddle.net/NYEaX/367/
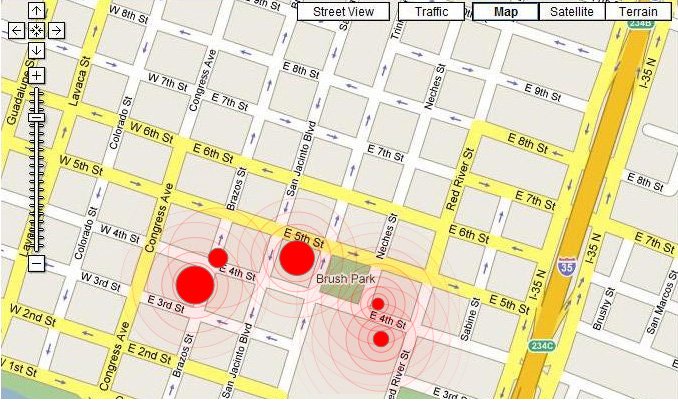
Это то, что я собираюсь построить - http://demo.joostkiens.com/het-parool-4g/
function makeRings() {
                            var datapoints = circleGroup.selectAll("circle");
                            var radius = 1;

                                function myTransition(circleData){

                                    var transition = d3.select(this).transition();

                                        speedLineGroup.append("circle")
                                          .attr({
                                                     "class": "ring",
                                                     "fill":"red",
                                                     "stroke":"red",
                                                     "cx": circleData.xcoord,
                                                     "cy": circleData.ycoord,
                                                     "r":radius,
                                                     "opacity": 0.4,
                                                     "fill-opacity":0.1
                                          })
                                          .transition()
                                          .duration(function(){
                                                return 100*circleData.alarmLevel;
                                          })
                                          .attr("r", radius + 100 )
                                          .attr("opacity", 0)
                                          .remove();
                                    transition.each('end', myTransition);
                                }

                          datapoints.each(myTransition);
                        }
2 ответа
Это, кажется, близко соответствует примеру. http://jsfiddle.net/NYEaX/468/
Вот настройки, которые я использовал.
                function getDurationPerDot(circleData){
                    var totalTime = 3000;//3 seconds max
                    var time = totalTime-(circleData.alarmLevel*10)
                    return time;
                }

                function getOuterRadiusPerDot(circleData){
                    var radius = circleData.alarmLevel*.5;
                    return radius;
                }
Here is some code/concepts that may help
window.setInterval(makeRings, 1000);

function makeRings() {

datapoints.each(function(circleData){
   //datapoints is your d3 selection of circle elements

speedLineGroup.append("circle")
  .attr({"class": "ring",
         "fill":"red", //or use CSS to set fill and stroke styles
         "stroke":"red",
         "cx": circleData.xCoord,
         "cy": circleData.yCoord,
             //position according to this circle's position
         "r":radius, //starting radius,
                     //set according to the radius used for data points
         "opacity": 0.8, //starting opacity
         "fill-opacity":0.5 //fill will always be half of the overall opacity
        })
  .transition()
  .duration( intensityTimeScale(circleData.intensity) )
      //Use an appropriate linear scale to set the time it takes for
      //the circles to expand to their maximum radius.
      //Note that you *don't* use function(d){}, since we're using the data
      //passed to the .each function from the data point, not data
      //attached to the ring
  .attr("r", radius + intensityRadiusScale(circleData.intensity) )
      //transition radius
      //again, create an appropriate linear scale
  .attr("opacity", 0) //transition opacity
  .remove(); //remove when transition is complete

});
}


    function myTransition(d){
var transition = d3.select(this).transition();

        //Forward transition behavior goes here
        //Probably create a new circle, expand all circles, fade out last circle

        transition.each('end', myTransition); //This calls the backward transition
    }

    d3.select('myFlashingElement').each(myTransition);
Используйте setInterval для регулярного вызова функции (например, один или два раза в секунду), которая создаст новое кольцо вокруг каждого круга данных.
Create the rings using an.each() call on your data circles, but add them to a different element, and/or with different class names so there is no confusion between the rings and the data points.
Установите начальный радиус кольца таким же, как точка данных, но затем немедленно начните переход на нем. Сделайте продолжительность перехода функцией значения данных "интенсивность" для соответствующего круга данных, а также сделайте конечный радиус функцией этого значения данных. Также измените непрозрачность до значения 0.
Make the final line of the transition for the rings.remove() so that each ring removes itself after it has finished expanding.
create looping transitions in d3 is to use the end callback on transitions. Create two functions, which each create a transition on your data, with one going from your start point to your end point, and the other going back, and have them call each other on completion, like so: