Удалить легенду при наведении курсора на гистограмму с помощью morris.js
Я использую библиотеку morris.js для создания диаграмм.
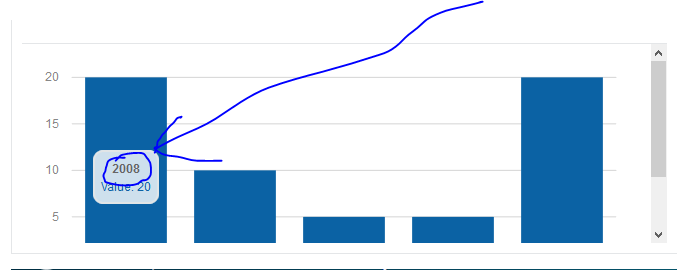
Я хочу удалить легенды парения с графика. Пожалуйста, проверьте картинку ниже для лучшего понимания. Как я могу их удалить? Есть идеи, чтобы это исправить? Заранее спасибо.
new Morris.Bar({
  // ID of the element in which to draw the chart.
  element: 'myfirstchart',
  // Chart data records -- each entry in this array corresponds to a point on
  // the chart.
  data: [
    {year: '2008', value: 20},
    {year: '2009', value: 10},
    {year: '2010', value: 5},
    {year: '2011', value: 5},
    {year: '2012', value: 20}
  ],
  // The name of the data record attribute that contains x-values.
  xkey: 'year',
  // A list of names of data record attributes that contain y-values.
  ykeys: ['value'],
  // Labels for the ykeys -- will be displayed when you hover over the
  // chart.
  labels: ['Value']
});
<link rel="stylesheet" href="//cdnjs.cloudflare.com/ajax/libs/morris.js/0.5.1/morris.css">
<script src="//ajax.googleapis.com/ajax/libs/jquery/1.9.0/jquery.min.js"></script>
<script src="//cdnjs.cloudflare.com/ajax/libs/raphael/2.1.0/raphael-min.js"></script>
<script src="//cdnjs.cloudflare.com/ajax/libs/morris.js/0.5.1/morris.min.js"></script>
<div id="myfirstchart" style="height: 250px;"></div>1 ответ
Решение
Чтобы отключить наведенную легенду, используйте hideHover свойство и установите его 'always',
hideHover свойство принимает следующие значения:
false(булево) - всегда показывать легендуtrue(булево) или'auto'(строка) - отображать легенду при наведении, только когда курсор мыши находится над графиком'always'(строка) - никогда не показывать легенду
new Morris.Bar({
  // ID of the element in which to draw the chart.
  element: 'myfirstchart',
  // Chart data records -- each entry in this array corresponds to a point on
  // the chart.
  data: [
    {year: '2008', value: 20},
    {year: '2009', value: 10},
    {year: '2010', value: 5},
    {year: '2011', value: 5},
    {year: '2012', value: 20}
  ],
  // The name of the data record attribute that contains x-values.
  xkey: 'year',
  // A list of names of data record attributes that contain y-values.
  ykeys: ['value'],
  // Labels for the ykeys -- will be displayed when you hover over the
  // chart.
  labels: ['Value'],
  // Remove hover legend
  hideHover: 'always'
});
<link rel="stylesheet" href="//cdnjs.cloudflare.com/ajax/libs/morris.js/0.5.1/morris.css">
<script src="//ajax.googleapis.com/ajax/libs/jquery/1.9.0/jquery.min.js"></script>
<script src="//cdnjs.cloudflare.com/ajax/libs/raphael/2.1.0/raphael-min.js"></script>
<script src="//cdnjs.cloudflare.com/ajax/libs/morris.js/0.5.1/morris.min.js"></script>
<div id="myfirstchart" style="height: 250px;"></div>Вы также можете настроить легенду при наведении, назначив callback функция к hoverCallback имущество:
new Morris.Bar({
  // ID of the element in which to draw the chart.
  element: 'myfirstchart',
  // Chart data records -- each entry in this array corresponds to a point on
  // the chart.
  data: [
    {year: '2008', value: 20},
    {year: '2009', value: 10},
    {year: '2010', value: 5},
    {year: '2011', value: 5},
    {year: '2012', value: 20}
  ],
  // The name of the data record attribute that contains x-values.
  xkey: 'year',
  // A list of names of data record attributes that contain y-values.
  ykeys: ['value'],
  // Labels for the ykeys -- will be displayed when you hover over the
  // chart.
  labels: ['Value'],
  // Customized hover legend via a callback
  hoverCallback: function (index, options, content, row) {
    return 'Legend ' + index + '<br> on year ' + row.year + '<br> with value ' + row.value;
  }
});
<link rel="stylesheet" href="//cdnjs.cloudflare.com/ajax/libs/morris.js/0.5.1/morris.css">
<script src="//ajax.googleapis.com/ajax/libs/jquery/1.9.0/jquery.min.js"></script>
<script src="//cdnjs.cloudflare.com/ajax/libs/raphael/2.1.0/raphael-min.js"></script>
<script src="//cdnjs.cloudflare.com/ajax/libs/morris.js/0.5.1/morris.min.js"></script>
<div id="myfirstchart" style="height: 250px;"></div>