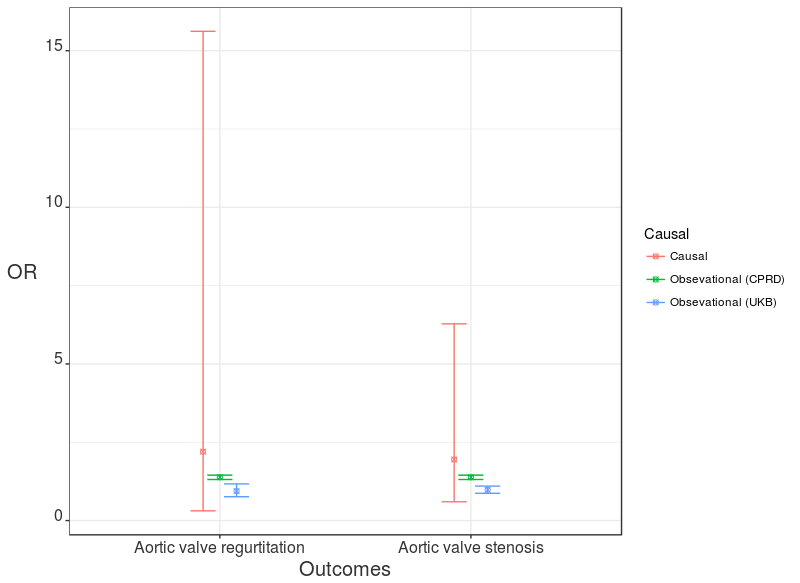
Добавления опорной линии и изменение значения оси у в строке ошибок
Как добавить опорную линию по оси Y на значение = 1? Кроме того, как я могу изменить значения оси Y, например, 1, 2, 3, 5, 10
library(ggplot2)

pd = position_dodge(.2)    ### How much to jitter the points on the plot

ggplot(plot,                ### The data frame to use.
       aes(x     = Outcomes,
           y     = Odds_ration,
           color = Causal)) +

  geom_point(shape = 13,
             size  = 1.5,
             position = pd) +

  geom_errorbar(aes(ymin  = L,
                    ymax  = U),
                width = 0.3,
                size  = 0.5,
                position = pd) +
  theme_bw() +
  theme(axis.text.x = element_text(colour="grey20",size=12,angle=0,hjust=.5,vjust=.5,face="plain"),
        axis.text.y = element_text(colour="grey20",size=12,angle=0,hjust=1,vjust=0,face="plain"),
        axis.title.x = element_text(colour="grey20",size=15,angle=0,hjust=.5,vjust=0,face="plain"),
        axis.title.y = element_text(colour="grey20",size=15,angle=0,hjust=.5,vjust=.5,face="plain")) +


  ylab("OR")
