Как мне написать / создать файл изображения GeoTIFF RGB на python?
У меня есть 5 numy массивов формы nx, ny
lons.shape = (nx,ny)
lats.shape = (nx,ny)
reds.shape = (nx,ny)
greens.shape = (nx,ny)
blues.shape = (nx,ny)
Красные, зеленые и синие массивы содержат значения в диапазоне от 0 до 255, а массивы широта / долгота представляют собой координаты пикселей широты / долготы.
У меня вопрос, как мне записать эти данные в геотиф?
В конечном итоге я хочу построить изображение с использованием базовой карты.
Вот код, который у меня есть, но я получаю огромный файл GeoTIFF (~500 МБ), и он становится пустым (просто черное изображение). Также обратите внимание, что nx, ny = 8120, 5416.
from osgeo import gdal
from osgeo import osr
import numpy as np
import h5py
import os

os.environ['GDAL_DATA'] = "/Users/andyprata/Library/Enthought/Canopy_64bit/User/share/gdal"

# read in data
input_path = '/Users/andyprata/Desktop/modisRGB/'
with h5py.File(input_path+'red.h5', "r") as f:
    red = f['red'].value
    lon = f['lons'].value
    lat = f['lats'].value

with h5py.File(input_path+'green.h5', "r") as f:
    green = f['green'].value

with h5py.File(input_path+'blue.h5', "r") as f:
    blue = f['blue'].value

# convert rgbs to uint8
r = red.astype('uint8')
g = green.astype('uint8')
b = blue.astype('uint8')

# set geotransform
nx = red.shape[0]
ny = red.shape[1]
xmin, ymin, xmax, ymax = [lon.min(), lat.min(), lon.max(), lat.max()]
xres = (xmax - xmin) / float(nx)
yres = (ymax - ymin) / float(ny)
geotransform = (xmin, xres, 0, ymax, 0, -yres)

# create the 3-band raster file
dst_ds = gdal.GetDriverByName('GTiff').Create('myGeoTIFF.tif', ny, nx, 3, gdal.GDT_Float32)
dst_ds.SetGeoTransform(geotransform)    # specify coords
srs = osr.SpatialReference()            # establish encoding
srs.ImportFromEPSG(3857)                # WGS84 lat/long
dst_ds.SetProjection(srs.ExportToWkt()) # export coords to file
dst_ds.GetRasterBand(1).WriteArray(r)   # write r-band to the raster
dst_ds.GetRasterBand(2).WriteArray(g)   # write g-band to the raster
dst_ds.GetRasterBand(3).WriteArray(b)   # write b-band to the raster
dst_ds.FlushCache()                     # write to disk
dst_ds = None                           # save, close
1 ответ
Я думаю, что проблема в том, что когда вы создаете набор данных, вы передаете его GDT_Float32. Для стандартных изображений с диапазоном пикселей 0-255 вам необходим GDT_Byte. Float требует, чтобы значения были между 0-1, как правило.
Я взял ваш код и случайно сгенерировал некоторые данные, чтобы проверить остальную часть вашего API. Затем я создал несколько фиктивных координат вокруг озера Тахо.
Вот код
#!/usr/bin/env python
from osgeo import gdal
from osgeo import osr
import numpy as np
import os, sys

#  Initialize the Image Size
image_size = (400,400)

#  Choose some Geographic Transform (Around Lake Tahoe)
lat = [39,38.5]
lon = [-120,-119.5]

#  Create Each Channel
r_pixels = np.zeros((image_size), dtype=np.uint8)
g_pixels = np.zeros((image_size), dtype=np.uint8)
b_pixels = np.zeros((image_size), dtype=np.uint8)

#  Set the Pixel Data (Create some boxes)
for x in range(0,image_size[0]):
    for y in range(0,image_size[1]):
        if x < image_size[0]/2 and y < image_size[1]/2:
            r_pixels[y,x] = 255
        elif x >= image_size[0]/2 and y < image_size[1]/2:
            g_pixels[y,x] = 255
        elif x < image_size[0]/2 and y >= image_size[1]/2:
            b_pixels[y,x] = 255
        else:
            r_pixels[y,x] = 255
            g_pixels[y,x] = 255
            b_pixels[y,x] = 255

# set geotransform
nx = image_size[0]
ny = image_size[1]
xmin, ymin, xmax, ymax = [min(lon), min(lat), max(lon), max(lat)]
xres = (xmax - xmin) / float(nx)
yres = (ymax - ymin) / float(ny)
geotransform = (xmin, xres, 0, ymax, 0, -yres)

# create the 3-band raster file
dst_ds = gdal.GetDriverByName('GTiff').Create('myGeoTIFF.tif', ny, nx, 3, gdal.GDT_Byte)

dst_ds.SetGeoTransform(geotransform)    # specify coords
srs = osr.SpatialReference()            # establish encoding
srs.ImportFromEPSG(3857)                # WGS84 lat/long
dst_ds.SetProjection(srs.ExportToWkt()) # export coords to file
dst_ds.GetRasterBand(1).WriteArray(r_pixels)   # write r-band to the raster
dst_ds.GetRasterBand(2).WriteArray(g_pixels)   # write g-band to the raster
dst_ds.GetRasterBand(3).WriteArray(b_pixels)   # write b-band to the raster
dst_ds.FlushCache()                     # write to disk
dst_ds = None
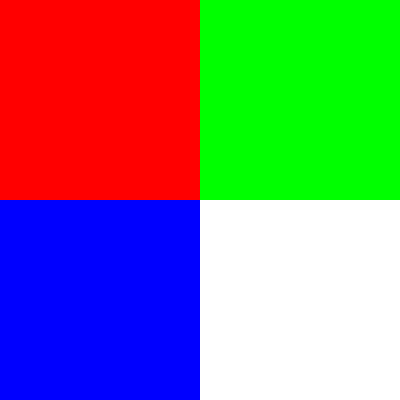
Вот выход. (Примечание: цель - создавать цвета, а не ландшафт!)
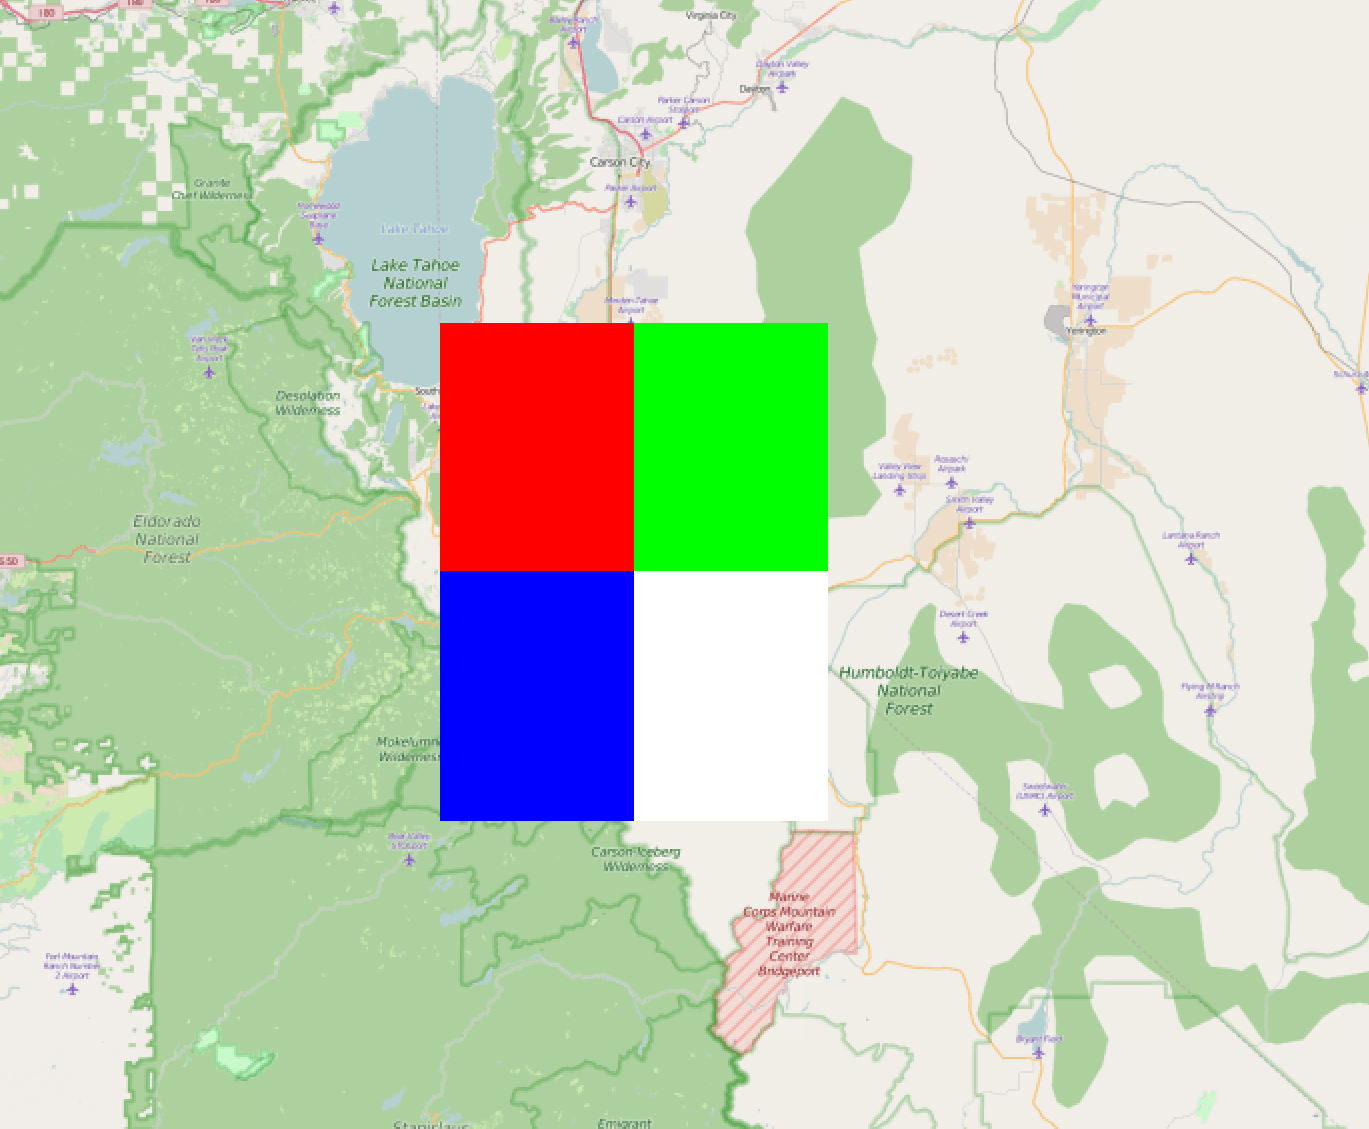
Вот изображение в QGIS, подтверждающее проекцию.

