Центроида Вороного тесселяции вокруг препятствий
Я пытаюсь реализовать алгоритм тесселяции Центроида Вороного в ограниченном прямоугольном пространстве так, чтобы в ограничивающем прямоугольнике было много препятствий (многоугольников).
Приведенный ниже код дает центроидальные воронои тесселяции в ограничительной рамке без наличия препятствий (полигонов). Синие точки - это генераторы, красные точки - центроиды, а желтые точки - между точками между синей и красной точками. 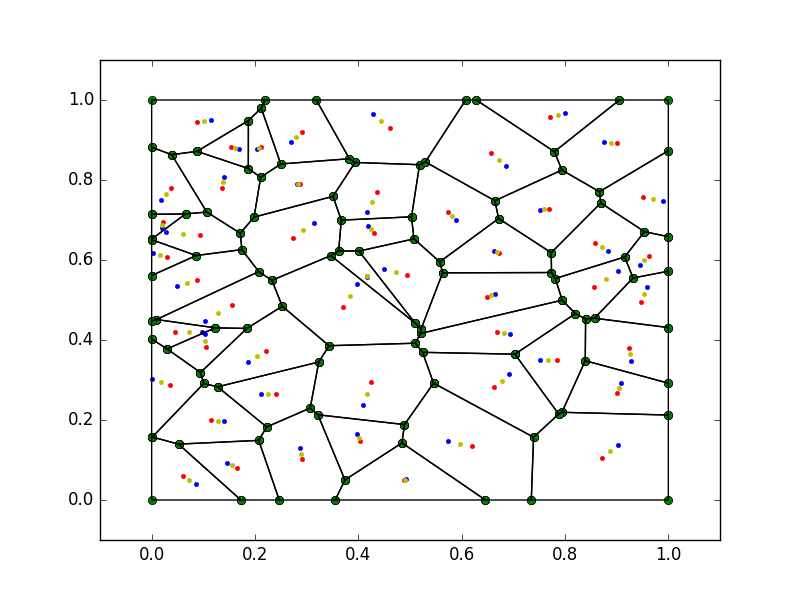
import matplotlib.pyplot as pl
import numpy as np
import scipy as sp
import scipy.spatial
import sys


np.random.seed(1)
eps = sys.float_info.epsilon

n_robots = 10
robots = np.random.rand(n_robots, 2)
#print(robots)
bounding_box = np.array([0., 1., 0., 1.])

def in_box(robots, bounding_box):
    return np.logical_and(np.logical_and(bounding_box[0] <= robots[:, 0],
                                         robots[:, 0] <= bounding_box[1]),
                          np.logical_and(bounding_box[2] <= robots[:, 1],
                                         robots[:, 1] <= bounding_box[3]))


def voronoi(robots, bounding_box):
    i = in_box(robots, bounding_box)
    points_center = robots[i, :]
    points_left = np.copy(points_center)
    points_left[:, 0] = bounding_box[0] - (points_left[:, 0] - bounding_box[0])
    points_right = np.copy(points_center)
    points_right[:, 0] = bounding_box[1] + (bounding_box[1] - points_right[:, 0])
    points_down = np.copy(points_center)
    points_down[:, 1] = bounding_box[2] - (points_down[:, 1] - bounding_box[2])
    points_up = np.copy(points_center)
    points_up[:, 1] = bounding_box[3] + (bounding_box[3] - points_up[:, 1])
    points = np.append(points_center,
                       np.append(np.append(points_left,
                                           points_right,
                                           axis=0),
                                 np.append(points_down,
                                           points_up,
                                           axis=0),
                                 axis=0),
                       axis=0)
# Compute Voronoi
    vor = sp.spatial.Voronoi(points)
    # Filter regions and select corresponding points
    regions = []
    points_to_filter = [] # we'll need to gather points too
    ind = np.arange(points.shape[0])
    ind = np.expand_dims(ind,axis= 1)

    for i,region in enumerate(vor.regions): # enumerate the regions
        if not region: # nicer to skip the empty region altogether
            continue

        flag = True
        for index in region:
            if index == -1:
                flag = False
                break
            else:
                x = vor.vertices[index, 0]
                y = vor.vertices[index, 1]
                if not(bounding_box[0] - eps <= x and x <= bounding_box[1] + eps and
                      bounding_box[2] - eps <= y and y <= bounding_box[3] + eps):
                    flag = False
                    break
        if flag:
            regions.append(region)

           # find the point which lies inside
            points_to_filter.append(vor.points[vor.point_region == i][0,:])

    vor.filtered_points = np.array(points_to_filter)
    vor.filtered_regions = regions
    return vor

def centroid_region(vertices):

    A = 0

    C_x = 0

    C_y = 0
    for i in range(0, len(vertices) - 1):
        s = (vertices[i, 0] * vertices[i + 1, 1] - vertices[i + 1, 0] * vertices[i, 1])
        A = A + s
        C_x = C_x + (vertices[i, 0] + vertices[i + 1, 0]) * s
        C_y = C_y + (vertices[i, 1] + vertices[i + 1, 1]) * s
    A = 0.5 * A
    C_x = (1.0 / (6.0 * A)) * C_x
    C_y = (1.0 / (6.0 * A)) * C_y
    return np.array([[C_x, C_y]])

def plot(r,index):
    vor = voronoi(r, bounding_box)

    fig = pl.figure()
    ax = fig.gca()
    #ax.plot(pol2[:,0],pol2[:,1],'k-')
# Plot initial points
    ax.plot(vor.filtered_points[:, 0], vor.filtered_points[:, 1], 'b.')
    print("initial",vor.filtered_points)
# Plot ridges points
    for region in vor.filtered_regions:
        vertices = vor.vertices[region, :]
        ax.plot(vertices[:, 0], vertices[:, 1], 'go')
# Plot ridges
    for region in vor.filtered_regions:
        vertices = vor.vertices[region + [region[0]], :]
        ax.plot(vertices[:, 0], vertices[:, 1], 'k-')
# Compute and plot centroids
    centroids = []
    for region in vor.filtered_regions:
        vertices = vor.vertices[region + [region[0]], :]
        centroid = centroid_region(vertices)
        centroids.append(list(centroid[0, :]))
        ax.plot(centroid[:, 0], centroid[:, 1], 'r.')
    centroids = np.asarray(centroids)
    rob = np.copy(vor.filtered_points)
    # the below code is for the plotting purpose the update happens in the update function
    interim_x = np.asarray(centroids[:,0] - rob[:,0])
    interim_y = np.asarray(centroids[:,1] - rob[:,1])
    magn = [np.linalg.norm(centroids[i,:] - rob[i,:]) for i in range(rob.shape[0])]
    x = np.copy(interim_x)
    x = np.asarray([interim_x[i]/magn[i] for i in range(interim_x.shape[0])])
    y = np.copy(interim_y)
    y = np.asarray([interim_y[i]/magn[i] for i in range(interim_y.shape[0])])
    nor = np.copy(rob)
    for i in range(x.shape[0]):
        nor[i,0] = x[i]
        nor[i,1] = y[i]
    temp = np.copy(rob)
    temp[:,0] = [rob[i,0] + 0.5*interim_x[i] for i in range(rob.shape[0])]
    temp[:,1] = [rob[i,1] + 0.5*interim_y[i] for i in range(rob.shape[0])]
    pol = [[]]
    ax.plot(temp[:,0] ,temp[:,1], 'y.' )
    ax.set_xlim([-0.1, 1.1])
    ax.set_ylim([-0.1, 1.1])
    pl.savefig("voronoi" + str(index) + ".png")
    return centroids

def update(rob,centroids):

  interim_x = np.asarray(centroids[:,0] - rob[:,0])
  interim_y = np.asarray(centroids[:,1] - rob[:,1])
  magn = [np.linalg.norm(centroids[i,:] - rob[i,:]) for i in range(rob.shape[0])]
  x = np.copy(interim_x)
  x = np.asarray([interim_x[i]/magn[i] for i in range(interim_x.shape[0])])
  y = np.copy(interim_y)
  y = np.asarray([interim_y[i]/magn[i] for i in range(interim_y.shape[0])])
  nor = [np.linalg.norm([x[i],y[i]]) for i in range(x.shape[0])]
  temp = np.copy(rob)
  temp[:,0] = [rob[i,0] + 0.5*interim_x[i] for i in range(rob.shape[0])]
  temp[:,1] = [rob[i,1] + 0.5*interim_y[i] for i in range(rob.shape[0])]
  return np.asarray(temp)

if __name__ == '__main__':
    for i in range(1):
        centroids = plot(robots,i)
        robots = update(robots,centroids)
Теперь я хочу расширить этот конкретный код на случай с препятствиями, т.е. я хочу сделать что-то вроде 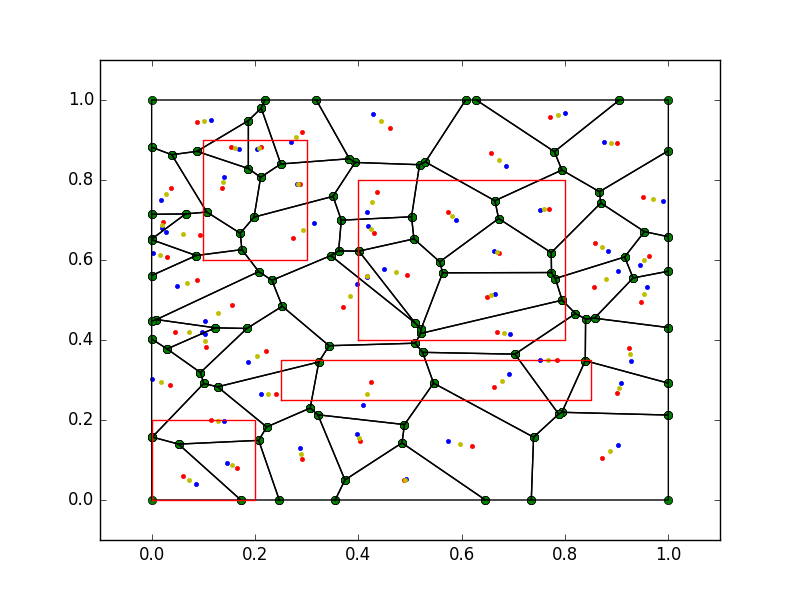 кроме того, что я не хочу ничего в красных полигонах.
Один из подходов, которые я попробовал, состоял в том, чтобы разделить пространство, используя свободную область, которая не удалась. 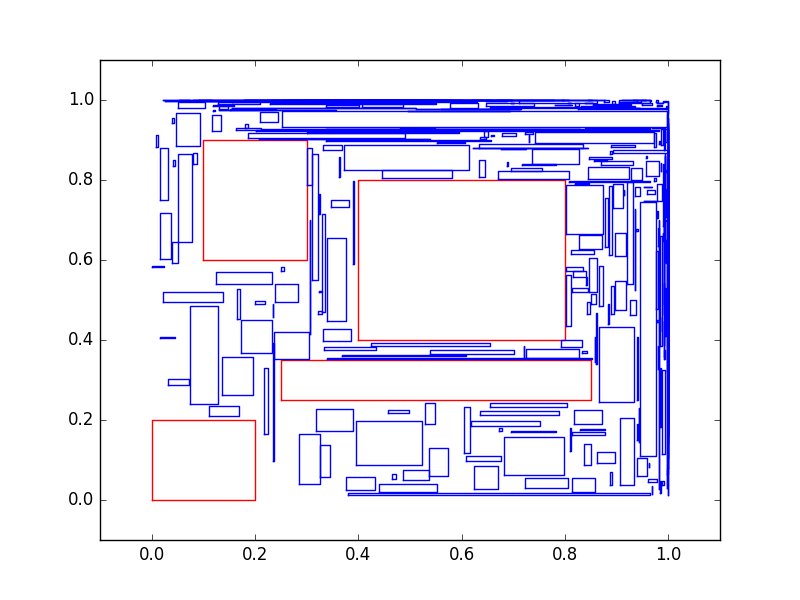 ,
,
Код для первого подхода:
import random
from shapely.geometry import Polygon, Point
import numpy as np
import matplotlib.pyplot as pl

def get_random_point_in_polygon(poly,polygons,num):
     (minx, miny, maxx, maxy) = poly.bounds
     points =[]
     while num != 0:
         p = Point(random.uniform(minx, maxx), random.uniform(miny, maxy))
         if any(poly.contains(p) for poly in polygons):
             continue
         else:
            num = num-1
            #print(num)
            points.append([p.x,p.y])
     return np.asarray(points)

def polysplit(poly,polygons):
     (minx, miny, maxx, maxy) = poly.bounds
     pols =[]

     return pols

def randomRects(p,poly):
    (minx, miny, maxx, maxy) = poly.bounds
    rect = []
    while True:
        w = round(random.uniform(0, 1),3)
        h = round(random.uniform(0, 1),3)

        if (((p[:,0]+w) < maxx) and ((p[:,1]+h) < maxy)):
            rect.append(np.squeeze([np.squeeze(p[:,0]),np.squeeze(p[:,1])]))
            rect.append(np.squeeze([np.squeeze(p[:,0]+w),np.squeeze(p[:,1])]))
            rect.append(np.squeeze([np.squeeze(p[:,0]+w),np.squeeze(p[:,1]+h)]))
            rect.append(np.squeeze([np.squeeze(p[:,0]),np.squeeze(p[:,1]+h)]))
            rect.append(np.squeeze([np.squeeze(p[:,0]),np.squeeze(p[:,1])]))


            break
        else:
            continue
    return np.asarray(rect)


def rect(poly,polygons):
    rec =[]
    area = poly.area
    areas = 0
    for i in polygons:
        areas = areas+i.area
    #print(area - areas)
    flag = False
    while (area - areas) > 0.4:
        p = get_random_point_in_polygon(poly,polygons,1)
        #print(p)
        rect = randomRects(p,poly)
        if any(poly.intersects(Polygon(rect)) for poly in polygons):

            continue
        #elif any(poly.intersects(Polygon(rect)) for poly in rec):
            #continue
        else:
            if rec == []:
                rec.append(Polygon(rect))
                print("hi")
            elif any(pol.intersects(Polygon(rect)) for pol in rec):
                continue
            else:
                areas = areas+Polygon(rect).area
                print(area-areas)
                rec.append(Polygon(rect))
    return rec
p = Polygon([(0, 0), (1, 0), (1, 1), (0, 1), (0, 0)])
p2 = Polygon([(0, 0), (.2,0), (.2,.2), (0, 0.2), (0,0)])
p3 = Polygon([(0.4, 0.4), (0.8,0.4), (.8,.8), (0.4, 0.8), (0.4,0.4)])
p4 = Polygon([(0.1,0.6),(0.3,.6),(0.3,0.9),(0.1,0.9),(0.1,0.6)])
p5 = Polygon([(0.25,0.25),(0.85,.25),(0.85,0.35),(0.25,0.35),(0.25,0.25)])
polygons = []
polygons.append(p2)
polygons.append(p3)
polygons.append(p4)
polygons.append(p5)
point_in_poly = get_random_point_in_polygon(p,polygons,10000)
fig = pl.figure()
ax = fig.gca()
#ax.plot(point_in_poly[:,0],point_in_poly[:,1],'b.')
area = 0
for po in polygons:
    #area = area +po.area

    x,y = po.exterior.xy
    #print [x,y]
    ax.plot(x,y,'r-')
#print(p.area - area)
r = rect(p,polygons)
for rr in r:
    #area = area +po.area

    x,y = rr.exterior.xy
    #print [x,y]
    ax.plot(x,y,'b-')


ax.set_xlim([-0.1, 1.1])
ax.set_ylim([-0.1, 1.1])
pl.savefig("test1.png")
Второй подход. Я решил использовать двоичное разделение пространства, чтобы разделить свободную область на прямоугольники и применить приведенный выше код к каждому из этих прямоугольников свободной области. Но я не уверен, как это сделать на питоне.
Третий подход: я использовал библиотеку треугольников Python для вычисления соответствующей ограниченной триангуляции Делоне для свободного пространства и попытался перенести ее обратно на диаграмму вороного. Результаты оказались не такими, как ожидалось.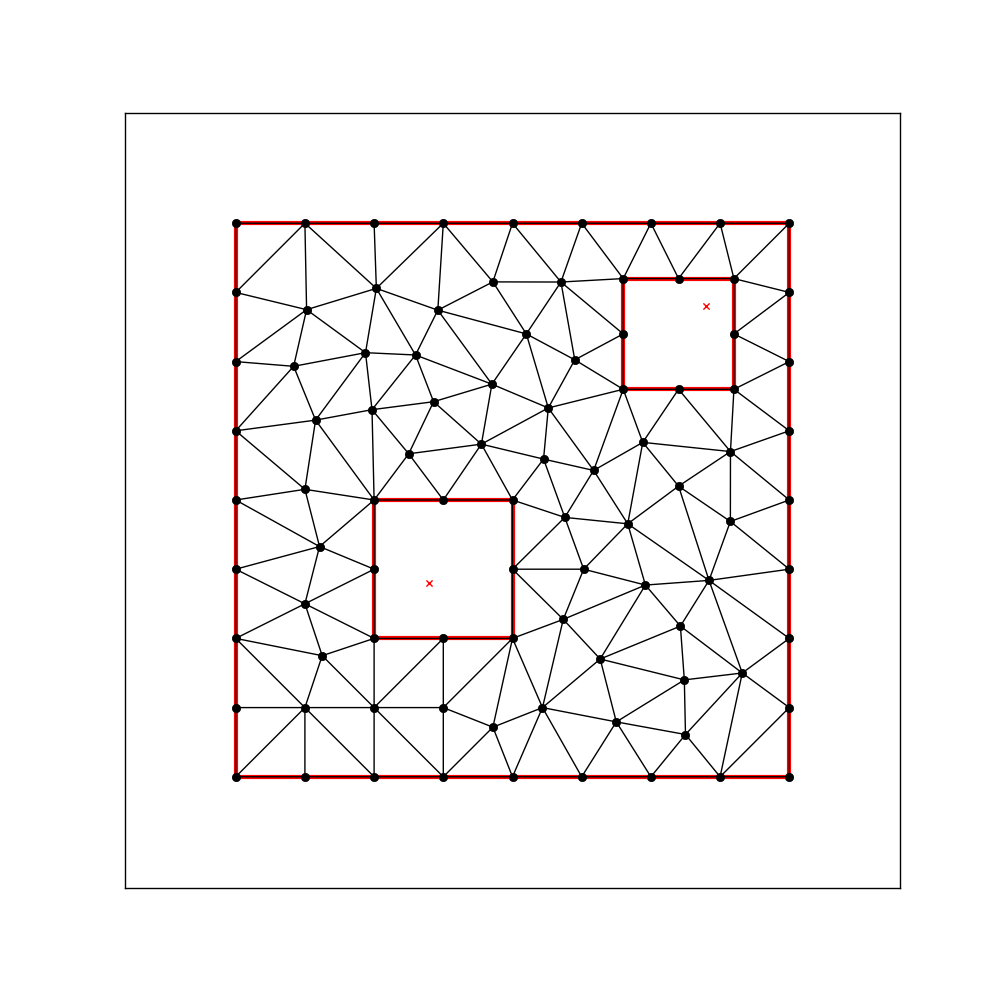 И его
И его 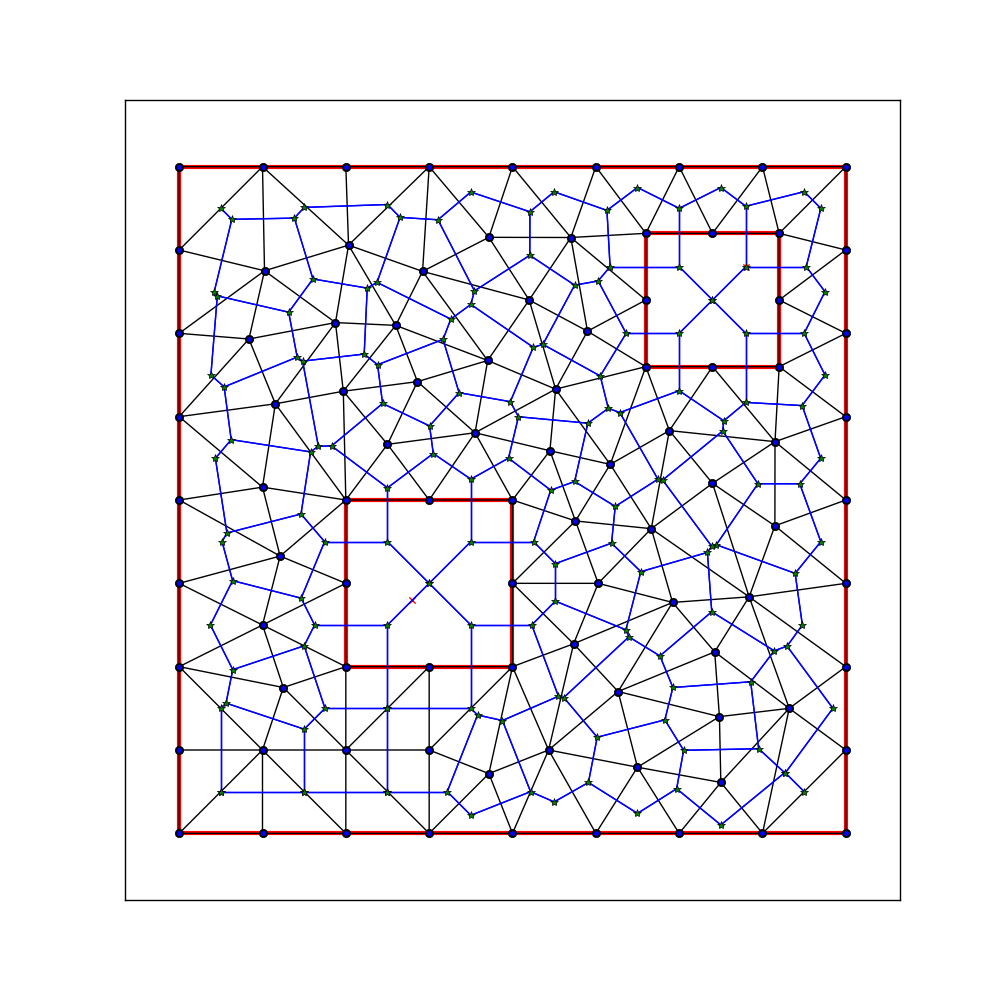
Приведенный ниже код представляет собой компиляцию всех методов, которые я попробовал, поэтому он может быть грязным. Я попытался использовать функцию Вороного в библиотеках Scipy,Triangle, а также попытался преобразовать триангуляцию в вороной, используя собственный подход. Код не работает хорошо, а также имеет некоторые ошибки.
from numpy import array
import numpy as np


def read_poly(file_name):
    """
    Simple poly-file reader, that creates a python dictionary
    with information about vertices, edges and holes.
    It assumes that vertices have no attributes or boundary markers.
    It assumes that edges have no boundary markers.
    No regional attributes or area constraints are parsed.
    """

    output = {'vertices': None, 'holes': None, 'segments': None}

    # open file and store lines in a list
    file = open(file_name, 'r')
    lines = file.readlines()
    file.close()
    lines = [x.strip('\n').split() for x in lines]

    # Store vertices
    vertices= []
    N_vertices, dimension, attr, bdry_markers = [int(x) for x in lines[0]]
    # We assume attr = bdrt_markers = 0
    for k in range(N_vertices):
        label, x, y = [items for items in lines[k+1]]
        vertices.append([float(x), float(y)])
    output['vertices']=array(vertices)

    # Store segments
    segments = []
    N_segments, bdry_markers = [int(x) for x in lines[N_vertices+1]]
    for k in range(N_segments):
        label, pointer_1, pointer_2 = [items for items in lines[N_vertices+k+2]]
        segments.append([int(pointer_1)-1, int(pointer_2)-1])
    output['segments'] = array(segments)

    # Store holes
    N_holes = int(lines[N_segments+N_vertices+2][0])
    holes = []
    for k in range(N_holes):
        label, x, y = [items for items in lines[N_segments + N_vertices + 3 + k]]
        holes.append([float(x), float(y)])

    output['holes'] = array(holes)
    print(holes)

    return output


from triangle import triangulate,voronoi, plot as tplot
import matplotlib.pyplot as plt
image = read_poly("/home/pranav/catkin_ws/src/beginner_tutorials/scripts/test.poly")
cncfq20adt = triangulate(image, 'pq20a.01D')
#print(cncfq20adt['vertices'])
#print(cncfq20adt['triangles'])
plt.figure(figsize=(10, 10))
ax = plt.subplot(111, aspect='equal')
tplot.plot(ax, **cncfq20adt)
plt.savefig("image.png")


import triangle
from scipy.spatial import Delaunay

pts = cncfq20adt['vertices']
tri = Delaunay(pts)
p = tri.points[tri.vertices]

#print(pts)
# Triangle vertices
A = p[:,0,:].T
B = p[:,1,:].T
C = p[:,2,:].T
print(C)
# See http://en.wikipedia.org/wiki/Circumscribed_circle#Circumscribed_circles_of_triangles
# The following is just a direct transcription of the formula there
a = A - C
b = B - C

def dot2(u, v):
    return u[0]*v[0] + u[1]*v[1]

def cross2(u, v, w):
    """u x (v x w)"""
    return dot2(u, w)*v - dot2(u, v)*w

def ncross2(u, v):
    """|| u x v ||^2"""
    return sq2(u)*sq2(v) - dot2(u, v)**2

def sq2(u):
    return dot2(u, u)

cc = cross2(sq2(a) * b - sq2(b) * a, a, b) / (2*ncross2(a, b)) + C

# Grab the Voronoi edges
vc = cc[:,tri.neighbors]
vc[:,tri.neighbors == -1] = np.nan # edges at infinity, plotting those would need more work...

lines = []
lines.extend(zip(cc.T, vc[:,:,0].T))
lines.extend(zip(cc.T, vc[:,:,1].T))
lines.extend(zip(cc.T, vc[:,:,2].T))

# Plot it
import matplotlib.pyplot as plt
from matplotlib.collections import LineCollection

lines = LineCollection(lines, edgecolor='b')

#plt.hold(1)
plt.plot(pts[:,0], pts[:,1], '.')
plt.plot(cc[0], cc[1], '*')
plt.gca().add_collection(lines)
plt.axis('equal')
plt.xlim(-0.1, 1.1)
plt.ylim(-0.1, 1.1)
plt.savefig("vor2.png")
ax1 = plt.subplot(121, aspect='equal')
triangle.plot.plot(ax1, vertices=pts)
lim = ax1.axis()

points, edges, ray_origin, ray_direct = triangle.voronoi(pts)
d = dict(vertices=points, edges=edges, ray_origins=ray_origin, ray_directions=ray_direct)
ax2 = plt.subplot(111, aspect='equal')
triangle.plot.plot(ax2, **d)
ax2.axis(lim)

plt.savefig("vor.png")


import matplotlib.pyplot as pl

import scipy as sp
import scipy.spatial
import sys
from shapely.geometry import Polygon,Point
import random
np.random.seed(1)
eps = sys.float_info.epsilon
"""
n_robots = 50
#robots = np.random.rand(n_robots, 2)

def get_random_point_in_polygon(poly,polygons,num):
     (minx, miny, maxx, maxy) = poly.bounds
     points =[]
     while num != 0:
         p = Point(random.uniform(minx, maxx), random.uniform(miny, maxy))
         if any(poly.contains(p) for poly in polygons):
             continue
         else:
          num = num-1
          print(num)
          points.append([p.x,p.y])
     return np.asarray(points)

def polysplit(poly,polygons):
    rectangles = []

    return rectangles
p = Polygon([(0, 0), (1, 0), (1, 1), (0, 1), (0, 0)])
p2 = Polygon([(0, 0), (.2,0), (.2,.2), (0, 0.2), (0,0)])
p3 = Polygon([(0.4, 0.4), (0.7,0.4), (.7,.7), (0.4, 0.7), (0.4,0.4)])
polygons = []
polygons.append(p2)
polygons.append(p3)
#point_in_poly = get_random_point_in_polygon(p,polygons,10)
robots = get_random_point_in_polygon(p,polygons,n_robots)

#print(sampl)
print(robots)
bounding_box = np.array([0., 1, 0., 1])
box = np.array([0.2, 0.6, 0, 0.6])
box2 = np.array([0, 0.6, 0.2, 0.6])
boxes =[]
boxes.append(box)
boxes.append(box2)
"""
robots = cncfq20adt['vertices']
print("length",len(robots))
bounding_box = np.array([0., 1., 0., 1.])

def in_box(robots, bounding_box):
    return np.logical_and(np.logical_and(bounding_box[0] <= robots[:, 0],
                                         robots[:, 0] <= bounding_box[1]),
                          np.logical_and(bounding_box[2] <= robots[:, 1],
                                         robots[:, 1] <= bounding_box[3]))


def voronoi(robots, bounding_box):
    i = in_box(robots, bounding_box)
    points_center = robots[i, :]
    points_left = np.copy(points_center)
    points_left[:, 0] = bounding_box[0] - (points_left[:, 0] - bounding_box[0])
    points_right = np.copy(points_center)
    points_right[:, 0] = bounding_box[1] + (bounding_box[1] - points_right[:, 0])
    points_down = np.copy(points_center)
    points_down[:, 1] = bounding_box[2] - (points_down[:, 1] - bounding_box[2])
    points_up = np.copy(points_center)
    points_up[:, 1] = bounding_box[3] + (bounding_box[3] - points_up[:, 1])
    points = np.append(points_center,
                       np.append(np.append(points_left,
                                           points_right,
                                           axis=0),
                                 np.append(points_down,
                                           points_up,
                                           axis=0),
                                 axis=0),
                       axis=0)
# Compute Voronoi
    vor = sp.spatial.Voronoi(points)
    # Filter regions and select corresponding points
    regions = []
    points_to_filter = [] # we'll need to gather points too
    ind = np.arange(points.shape[0])
    ind = np.expand_dims(ind,axis= 1)

    for i,region in enumerate(vor.regions): # enumerate the regions
        if not region: # nicer to skip the empty region altogether
            continue

        flag = True
        for index in region:
            if index == -1:
                flag = False
                break
            else:
                x = vor.vertices[index, 0]
                y = vor.vertices[index, 1]
                if not(bounding_box[0] - eps <= x and x <= bounding_box[1] + eps and
                      bounding_box[2] - eps <= y and y <= bounding_box[3] + eps):
                    flag = False
                    break
        if flag:
            regions.append(region)

           # find the point which lies inside
            points_to_filter.append(vor.points[vor.point_region == i][0,:])

    vor.filtered_points = np.array(points_to_filter)
    vor.filtered_regions = regions
    return vor

def centroid_region(vertices):

    A = 0

    C_x = 0

    C_y = 0
    for i in range(0, len(vertices) - 1):
        s = (vertices[i, 0] * vertices[i + 1, 1] - vertices[i + 1, 0] * vertices[i, 1])
        A = A + s
        C_x = C_x + (vertices[i, 0] + vertices[i + 1, 0]) * s
        C_y = C_y + (vertices[i, 1] + vertices[i + 1, 1]) * s
    A = 0.5 * A
    C_x = (1.0 / (6.0 * A)) * C_x
    C_y = (1.0 / (6.0 * A)) * C_y
    return np.array([[C_x, C_y]])

def plot(r,index):
    vor = voronoi(r, bounding_box)

    fig = pl.figure()
    ax = fig.gca()
    #ax.plot(pol2[:,0],pol2[:,1],'k-')
# Plot initial points
    ax.plot(vor.filtered_points[:, 0], vor.filtered_points[:, 1], 'b.')
    print("initial",vor.filtered_points)
# Plot ridges points
    for region in vor.filtered_regions:
        vertices = vor.vertices[region, :]
        ax.plot(vertices[:, 0], vertices[:, 1], 'go')
# Plot ridges
    for region in vor.filtered_regions:
        vertices = vor.vertices[region + [region[0]], :]
        ax.plot(vertices[:, 0], vertices[:, 1], 'k-')
# Compute and plot centroids
    centroids = []
    for region in vor.filtered_regions:
        vertices = vor.vertices[region + [region[0]], :]
        centroid = centroid_region(vertices)
        centroids.append(list(centroid[0, :]))
        ax.plot(centroid[:, 0], centroid[:, 1], 'r.')
    centroids = np.asarray(centroids)
    rob = np.copy(vor.filtered_points)
    # the below code is for the plotting purpose the update happens in the update function
    interim_x = np.asarray(centroids[:,0] - rob[:,0])
    interim_y = np.asarray(centroids[:,1] - rob[:,1])
    magn = [np.linalg.norm(centroids[i,:] - rob[i,:]) for i in range(rob.shape[0])]
    x = np.copy(interim_x)
    x = np.asarray([interim_x[i]/magn[i] for i in range(interim_x.shape[0])])
    y = np.copy(interim_y)
    y = np.asarray([interim_y[i]/magn[i] for i in range(interim_y.shape[0])])
    nor = np.copy(rob)
    for i in range(x.shape[0]):
        nor[i,0] = x[i]
        nor[i,1] = y[i]
    temp = np.copy(rob)
    temp[:,0] = [rob[i,0] + 0.5*interim_x[i] for i in range(rob.shape[0])]
    temp[:,1] = [rob[i,1] + 0.5*interim_y[i] for i in range(rob.shape[0])]
    pol = [[]]
    ax.plot(temp[:,0] ,temp[:,1], 'y.' )
    ax.set_xlim([-0.1, 1.1])
    ax.set_ylim([-0.1, 1.1])
    pl.savefig("voronoi" + str(index) + ".png")
    return centroids

def update(rob,centroids):

  interim_x = np.asarray(centroids[:,0] - rob[:,0])
  interim_y = np.asarray(centroids[:,1] - rob[:,1])
  magn = [np.linalg.norm(centroids[i,:] - rob[i,:]) for i in range(rob.shape[0])]
  x = np.copy(interim_x)
  x = np.asarray([interim_x[i]/magn[i] for i in range(interim_x.shape[0])])
  y = np.copy(interim_y)
  y = np.asarray([interim_y[i]/magn[i] for i in range(interim_y.shape[0])])
  nor = [np.linalg.norm([x[i],y[i]]) for i in range(x.shape[0])]
  temp = np.copy(rob)
  temp[:,0] = [rob[i,0] + 0.5*interim_x[i] for i in range(rob.shape[0])]
  temp[:,1] = [rob[i,1] + 0.5*interim_y[i] for i in range(rob.shape[0])]
  return np.asarray(temp)

if __name__ == '__main__':
    for i in range(1):
        centroids = plot(robots,i)
        robots = update(robots,centroids)
Я буду очень благодарен, если кто-нибудь сможет мне помочь.
1 ответ
Я искал решение этой проблемы и обнаружил, что большую часть работы за меня сделали несколько очень умных людей! Существует полезный пакет под названием geovoronoi, который выполняет расчеты voronoi на ограниченных пространствах с помощью стройных многоугольников, а затем их можно построить с помощью кода из: https://sgillies.net/2010/04/06/painting-punctured-polygons-with-matplotlib.html.
Я собрал следующий код, который должен помочь
      from geovoronoi import voronoi_regions_from_coords

import numpy as np
from shapely.geometry import MultiPolygon, Polygon, Point
import matplotlib.pyplot as plt
from matplotlib.patches import Polygon as mPolygon
from shapely.geometry.polygon import LinearRing
from matplotlib.patches import PathPatch
from matplotlib.path import Path


def RingCoding(ob):
    # The codes will be all "LINETO" commands, except for "MOVETO"s at the
    # beginning of each subpath
    n = len(ob.coords)
    codes = np.ones(n, dtype=Path.code_type) * Path.LINETO
    codes[0] = Path.MOVETO
    return codes

def Pathify(polygon):
    # Convert coordinates to path vertices. Objects produced by Shapely's
    # analytic methods have the proper coordinate order, no need to sort.
    vertices = np.concatenate(
                    [np.asarray(polygon.exterior)]
                    + [np.asarray(r) for r in polygon.interiors])
    codes = np.concatenate(
                [RingCoding(polygon.exterior)]
                + [RingCoding(r) for r in polygon.interiors])
    return Path(vertices, codes)

def CreatePatch(poly,area_override=None):
    MAX_DENSITY = 0.75
    area = poly.area
    if area_override is not None:
        area=area_override
    density = 1 / area
    color = (min(1, density / MAX_DENSITY), max(0, (MAX_DENSITY - density) / MAX_DENSITY), 0, 0.5)
    region_external_coords = list(poly.exterior.coords)

    if len(poly.interiors) > 0:
        path = Pathify(poly)
        patch = PathPatch(path, facecolor=color, edgecolor=color)
    else:
        patch = mPolygon(region_external_coords, True)
    patch.set_color(color)
    return patch

def main():
    coords = np.array([[-29, 4], [-6, 3], [-1, -1], [-1.5, 0], [-9, -2],
                       [0, 0], [-1, 0], [3, 7], [3.2, 6.8],
                       [3.5, 7.2], [0.1, 2], [-3, 3],
                        [10, 10], [7, 15]
                       ])

    #DEFINE EXTERIOR POLYGONS HERE
    a = [(-40, -4), (-40, 6), (2,6), (2, -4), (-40, -4)]
    b = [(2, 6), (14, 6), (14, 19), (2, 19), (2, 6)]

    #DEFINE INTERNAL HOLES HERE
    hole_a_1 = LinearRing([(-20,-2), (-25,-2), (-25, 2),(-20, 2), (-20, -2)])
    hole_a_2 = LinearRing([(-30, -2), (-35, -2), (-35, 2), (-30, 2), (-30, -2)])
    hole_a_3 = LinearRing([(-20, 4.9), (-10, 4.9), (-10, 2), (-20, 4.9),])

    shapely_poly = MultiPolygon([[a, [hole_a_1, hole_a_2, hole_a_3]], [b,[]]])

    min_x, min_y = np.inf, np.inf
    max_x, max_y = -np.inf, -np.inf
    for poly in shapely_poly:
        bounds=poly.bounds
        min_x=min(bounds[0], min_x)
        max_x=max(bounds[2], max_x)
        min_y=min(bounds[1], min_y)
        max_y=max(bounds[3], max_y)

    fig, ax = plt.subplots()
    ax.set_xlim(min_x-5, max_x+5)
    ax.set_ylim(min_y-5, max_y+5)

    # this creates a dictionary of polygons/multipolygons
    # and a dictionary of lists, indicating which point is in those polygons
    # (if there are identical points, those lists might have 2+ numbers in them)
    region_polys, region_pts = voronoi_regions_from_coords(coords, shapely_poly)

    for i in region_polys:
        if type(region_polys[i]) is MultiPolygon:
            # this means that the voronoi cell is technically a multipolygon.
            # while you could argue whether this should ever occur, the current implementation
            # does this.
            # so, we should probably check which polygon actually contains the point.
            point=region_pts[i][0]
            temp_point=Point(coords[point])
            for poly in region_polys[i]:
                if poly.contains(temp_point):
                    #this is the one.
                    patch=CreatePatch(poly)
                    ax.add_patch(patch)
                    temp_area=poly.area
            for poly in region_polys[i]:
                if not poly.contains(temp_point):
                    patch=CreatePatch(poly, temp_area)
                    ax.add_patch(patch)

        else:
            patch=CreatePatch(region_polys[i])
            ax.add_patch(patch)

    points=list(zip(*coords))
    plt.scatter(points[0], points[1])
    plt.show()

if __name__=="__main__":
    main()