Сопоставьте эстетику с геометрией LINESTRING с помощью sf в R
Новый sf Пакет для R позволяет действительно легко работать с географическими данными в R, а также с развитой версией ggplot2 есть новый geom_sf() слой для построения географических данных в стиле sf.
В пределах sf парадигма работы с данными, можно ли сопоставить эстетику ggplot с LINESTRING геометрий?
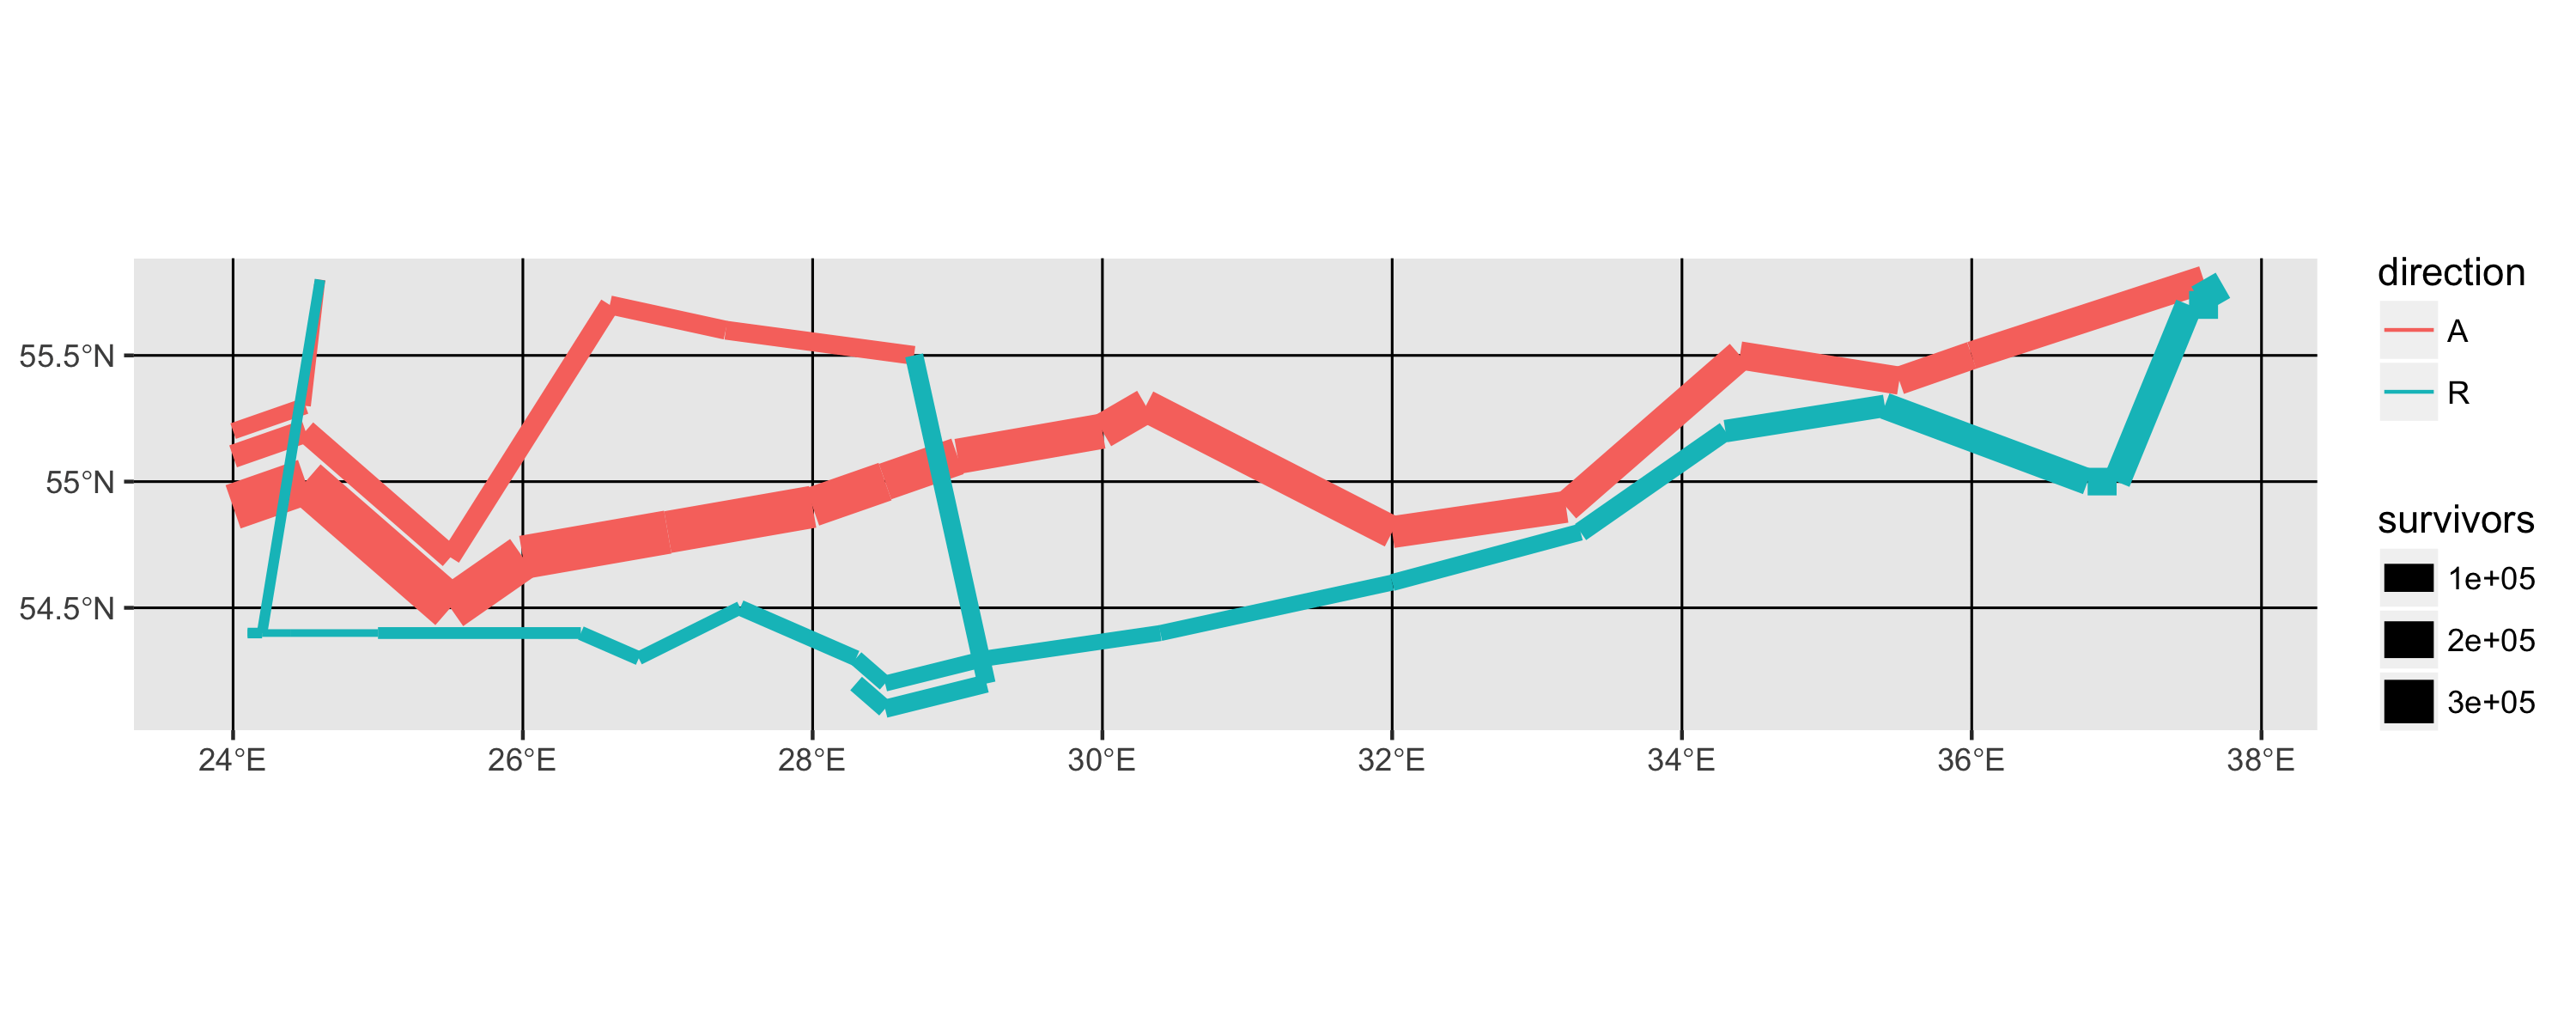
Например, с помощью стандартного ggplot можно воссоздать знаменитый заговор выживших Минарда из Великой Армии Наполеона в 1812 году с помощью ggplot, и эти данные определяют размер армии по количеству выживших:
# Install the dev version of ggplot2 for geom_sf()
# devtools::install_github("tidyverse/ggplot2")
library(tidyverse)

troops <- read_csv("https://gist.githubusercontent.com/andrewheiss/69b9dffb7cca392eb7f9bdf56789140f/raw/3e2a48635ae44837955765b5e7747c429b0b5d71/troops.csv")

ggplot(troops) +
  geom_path(aes(x = long, y = lat, color = direction,
                group = group, size = survivors),
            lineend = "round")

Мы можем работать с этими данными войск как sf объект путем создания нового geometry колонка, вот так:
library(sf)
#> Linking to GEOS 3.6.1, GDAL 2.1.3, proj.4 4.9.3

troops_with_geometry <- troops %>%
  st_as_sf(coords = c("long", "lat"))

head(troops_with_geometry)
#> Simple feature collection with 6 features and 3 fields
#> geometry type:  POINT
#> dimension:      XY
#> bbox:           xmin: 24 ymin: 54.5 xmax: 28 ymax: 55
#> epsg (SRID):    NA
#> proj4string:    NA
#> # A tibble: 6 x 4
#>   survivors direction group          geometry
#>       <int>     <chr> <int>  <simple_feature>
#> 1    340000         A     1 <POINT (24 54.9)>
#> 2    340000         A     1 <POINT (24.5 55)>
#> 3    340000         A     1 <POINT (25.5 ...>
#> 4    320000         A     1 <POINT (26 54.7)>
#> 5    300000         A     1 <POINT (27 54.8)>
#> 6    280000         A     1 <POINT (28 54.9)>
Если мы построим это с geom_sf, ggplot будет использовать точки:
ggplot(troops_with_geometry) +
  geom_sf(aes(color = direction, group = group))

Мы можем создавать строки строк для каждой из групп и направлений путем группировки, суммирования и приведения.
troops_lines <- troops_with_geometry %>%
  group_by(direction, group) %>%
  summarize() %>%
  st_cast("LINESTRING")

head(troops_lines)
#> Simple feature collection with 6 features and 2 fields
#> geometry type:  LINESTRING
#> dimension:      XY
#> bbox:           xmin: 24 ymin: 54.1 xmax: 37.7 ymax: 55.8
#> epsg (SRID):    NA
#> proj4string:    NA
#>   direction group                       geometry
#> 1         A     1 LINESTRING (24 54.9, 24.5 5...
#> 2         A     2 LINESTRING (24 55.1, 24.5 5...
#> 3         A     3 LINESTRING (24 55.2, 24.5 5...
#> 4         R     1 LINESTRING (24.1 54.4, 24.2...
#> 5         R     2 LINESTRING (28.3 54.2, 28.5...
#> 6         R     3 LINESTRING (24.1 54.4, 24.2...
Затем ggplot может построить эти шесть соединенных линий и правильно их раскрасить:
ggplot(troops_lines) +
  geom_sf(aes(color = direction, group = group))

Тем не менее, данные о выживших в настоящее время ушли, и нет никакой возможности отобразить эстетику размера в новые строки.
Есть ли способ связать другую эстетику (например, размер) с sf -основан LINESTRING данные? Или, другими словами, есть ли способ воссоздать ggplot(...) + geom_path(aes(x = long, y = lat, size = something)) с помощью geom_sf() а sf парадигма работы с географическими данными?
1 ответ
 Вам необходимо создать линейную линию из каждой пары точек в каждой группе. Результат не такой красивый, потому что я не знаю, как сделать линии вокруг конечных точек.
# within each group repeat each point
# then slice the first and last out and
# add a variable called linegroup, which provides grouping for start and endpoints of each line
troops %<>% group_by(group) %>%
  slice(rep(1:n(), each = 2)) %>%
  slice(-c(1, n())) %>%
  mutate(linegroup = lapply(1:(n()/2), function(x) rep(x, 2)) %>% unlist) %>%
  ungroup

# create linestring sf object by summarizing the points,
# grab the last survivor and direction value of each group (i.e. the 'endpoint' value)
troops_line <- st_as_sf(troops, coords = c("long", "lat"), crs = 4326) %>%
  group_by(group, linegroup) %>%
  summarise(survivors = last(survivors), direction = last(direction), do_union = FALSE) %>%
  st_cast("LINESTRING")

gp <- ggplot(troops_line) +
  geom_sf(aes(color = direction, size = survivors), show.legend = "line")