Matplotlib захватывает только центральные частоты каждого бина
Я хочу знать, если функция Matplotlib spectrogram только учитывает центральные частоты сигнала?
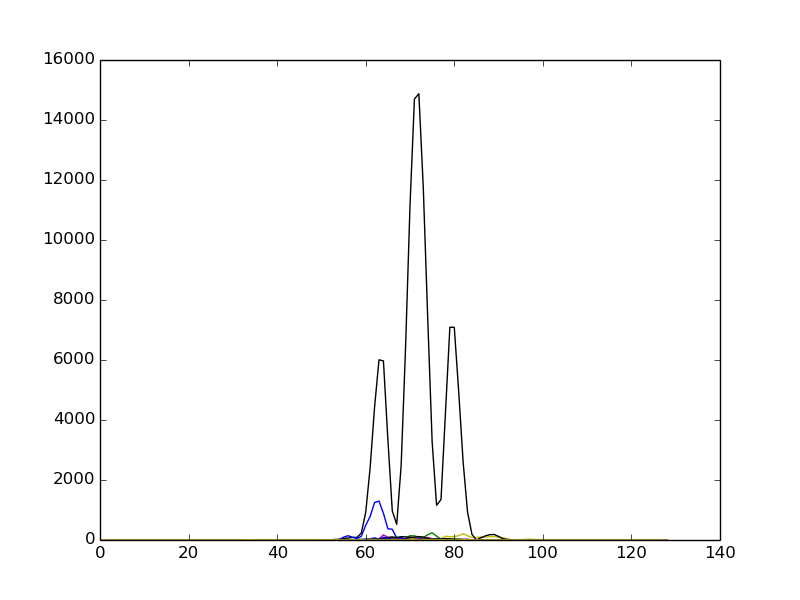
Например, построение спектрограммы (без децибел) здесь является результатом:

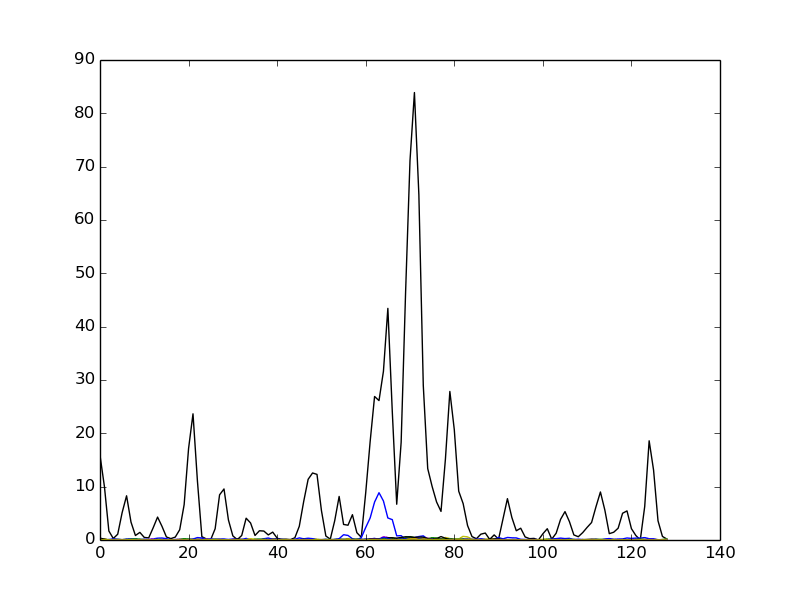
Построение спектрограммы обычно:

Где эти точки идут от 0 до 50) и между (80-140) они удаляются? Если так.. Почему это именно так?
РЕДАКТИРОВАТЬ: Исходный код:-
Вот "matplotlib" spectral_helper
def _spectral_helper2(x, y=None, NFFT=None, Fs=None, detrend_func=None,
                      window=None, noverlap=None, pad_to=None,
                      sides=None, scale_by_freq=None, mode=None):

    '''
    This is a helper function that implements the commonality between the
    psd, csd, spectrogram and complex, magnitude, angle, and phase spectrums.
    It is *NOT* meant to be used outside of mlab and may change at any time.
    '''
    if y is None:
        # if y is None use x for y
        same_data = True
    else:
        #The checks for if y is x are so that we can use the same function to
        #implement the core of psd(), csd(), and spectrogram() without doing
        #extra calculations.  We return the unaveraged Pxy, freqs, and t.
        same_data = y is x

    if Fs is None:
        Fs = 2
    if noverlap is None:
        noverlap = 0
    if detrend_func is None:
        detrend_func = detrend_none
    if window is None:
        window = window_hanning

    # if NFFT is set to None use the whole signal
    if NFFT is None:
        NFFT = 256

    if mode is None or mode == 'default':
        mode = 'psd'
    elif mode not in ['psd', 'complex', 'magnitude', 'angle', 'phase']:
        raise ValueError("Unknown value for mode %s, must be one of: "
                         "'default', 'psd', 'complex', "
                         "'magnitude', 'angle', 'phase'" % mode)

    if not same_data and mode != 'psd':
        raise ValueError("x and y must be equal if mode is not 'psd'")

    #Make sure we're dealing with a numpy array. If y and x were the same
    #object to start with, keep them that way
    x = np.asarray(x)
    if not same_data:
        y = np.asarray(y)

    if sides is None or sides == 'default':
        if np.iscomplexobj(x):
            sides = 'twosided'
        else:
            sides = 'onesided'
    elif sides not in ['onesided', 'twosided']:
        raise ValueError("Unknown value for sides %s, must be one of: "
                         "'default', 'onesided', or 'twosided'" % sides)

    # zero pad x and y up to NFFT if they are shorter than NFFT
    if len(x) < NFFT:
        n = len(x)
        x = np.resize(x, (NFFT,))
        x[n:] = 0

    if not same_data and len(y) < NFFT:
        n = len(y)
        y = np.resize(y, (NFFT,))
        y[n:] = 0

    if pad_to is None:
        pad_to = NFFT

    if mode != 'psd':
        scale_by_freq = False
    elif scale_by_freq is None:
        scale_by_freq = True

    # For real x, ignore the negative frequencies unless told otherwise
    if sides == 'twosided':
        numFreqs = pad_to
        if pad_to % 2:
            freqcenter = (pad_to - 1)//2 + 1
        else:
            freqcenter = pad_to//2
        scaling_factor = 1.
    elif sides == 'onesided':
        if pad_to % 2:
            numFreqs = (pad_to + 1)//2
        else:
            numFreqs = pad_to//2 + 1
        scaling_factor = 2.

    result = stride_windows(x, NFFT, noverlap, axis=0)
    result = detrend(result, detrend_func, axis=0)
    result, windowVals = apply_window(result, window, axis=0,
                                      return_window=True)
    result = np.fft.fft(result, n=pad_to, axis=0)[:numFreqs, :]
    freqs = np.fft.fftfreq(pad_to, 1/Fs)[:numFreqs]

    if not same_data:
        # if same_data is False, mode must be 'psd'
        #resultY = stride_windows(y, NFFT, noverlap)
        resultY = apply_window(resultY, window, axis=0)
        resultY = detrend(resultY, detrend_func, axis=0)
        resultY = np.fft.fft(resultY, n=pad_to, axis=0)[:numFreqs, :]
        result = np.conjugate(result) * resultY
    elif mode == 'psd':
        result = np.conjugate(result) * result
    elif mode == 'magnitude':
        result = np.absolute(result)
    elif mode == 'angle' or mode == 'phase':
        # we unwrap the phase later to handle the onesided vs. twosided case
        result = np.angle(result)
    elif mode == 'complex':
        pass

    if mode == 'psd':
        # Scale the spectrum by the norm of the window to compensate for
        # windowing loss; see Bendat & Piersol Sec 11.5.2.
        #result /= (np.abs(windowVals)**2).sum()

        # Also include scaling factors for one-sided densities and dividing by
        # the sampling frequency, if desired. Scale everything, except the DC
        # component and the NFFT/2 component:
        result[1:-1] *= 1554848

        # MATLAB divides by the sampling frequency so that density function
        # has units of dB/Hz and can be integrated by the plotted frequency
        # values. Perform the same scaling here.
        if scale_by_freq:
            result /= Fs

    t = np.arange(NFFT/2, len(x) - NFFT/2 + 1, NFFT - noverlap)/Fs

    if sides == 'twosided':
        # center the frequency range at zero
        freqs = np.concatenate((freqs[freqcenter:], freqs[:freqcenter]))
       # result = np.concatenate((result[freqcenter:, :],
                                 #result[:freqcenter, :]), 0)
    elif not pad_to % 2:
        # get the last value correctly, it is negative otherwise
        freqs[-1] *= -1

    # we unwrap the phase here to handle the onesided vs. twosided case
    if mode == 'phase':
        pass
        #result = np.unwrap(result, axis=0)
    return result, freqs, t
Вот моя попытка в C++
std::vector<std::vector<Complex::complex> > ComputeSTFT(std::vector<double> &vals,
std::size_t NFFT, std::size_t overlap)
{
std::vector<double> hanning = getHanningWindow(NFFT);
double NENBW = 0.0;
double ENBW = 0.0;
double fRes = 0.0;

double avg = 0.0;
for(unsigned i=0; (i < vals.size()); i++)
{
    avg+= vals[i];
}

avg = avg / vals.size();

for(unsigned i=0; (i < vals.size()); i++)
{
    vals[i] = vals[i] - avg;
}

std::vector<std::vector<double> > temp_vars = frame(vals, NFFT, overlap);
std::vector<std::vector<Complex::complex> > STFT(temp_vars.size());
for(unsigned i=0; (i < temp_vars.size()-1); i++)
{
    for(unsigned j=0; (j < temp_vars[i].size()); j++) {
        double value = 0.5 * (1 - cos(2 * PI * j / (NFFT - 1)));
        S1 += value;
        S2 += value * value;

        double calculation = temp_vars[i][j] * value;
        temp_vars[i][j] = calculation;
    }
}

NENBW = NFFT * (S2 / S1*S1);

// This assume that the frequency is KNOWN.
fRes = 12000 / NFFT;

ENBW = NENBW * fRes;

std::vector<std::vector<Complex::complex>  > fft_vars(temp_vars.size());
for(unsigned i=0; (i < temp_vars.size()); i++)
{
    fft_vars.resize(temp_vars[i].size());
    FFT f(temp_vars[i].begin(), temp_vars[i].end(), temp_vars[i].size());
    std::vector<Complex::complex> temp_fft = f.transformed();
    fft_vars[i] = temp_fft;
    temp_fft.empty();
}

std::vector<std::vector<double> > RESULT(temp_vars.size());

for(unsigned i=0; (i < temp_vars.size()); i++)
{
    STFT[i].resize(temp_vars[i].size()/2+1);
    for(unsigned j=0; (j < temp_vars[i].size()/2 + 1); j++)
    {
        STFT[i][j].re = fft_vars[i][j].re;
        STFT[i][j].im = fft_vars[i][j].im;
    }
}


return STFT;
 }
Где я иду не так, чтобы получить такие разные результаты?