Добавление местоположений точек на график 3D DEM в R
У меня есть несколько точечных местоположений, которые включают UTM и Elevation в качестве фрейма данных. У меня также есть слой DEM.
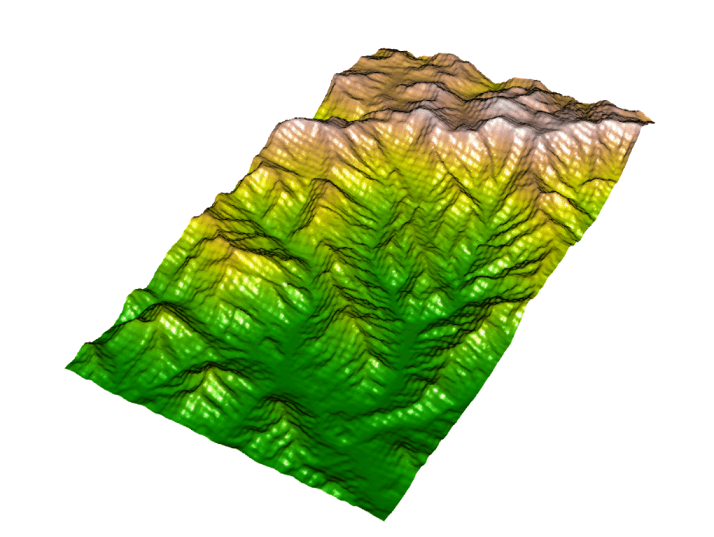
Я понял, как построить матрицу высот в 3D, используя plot3D в rgl,
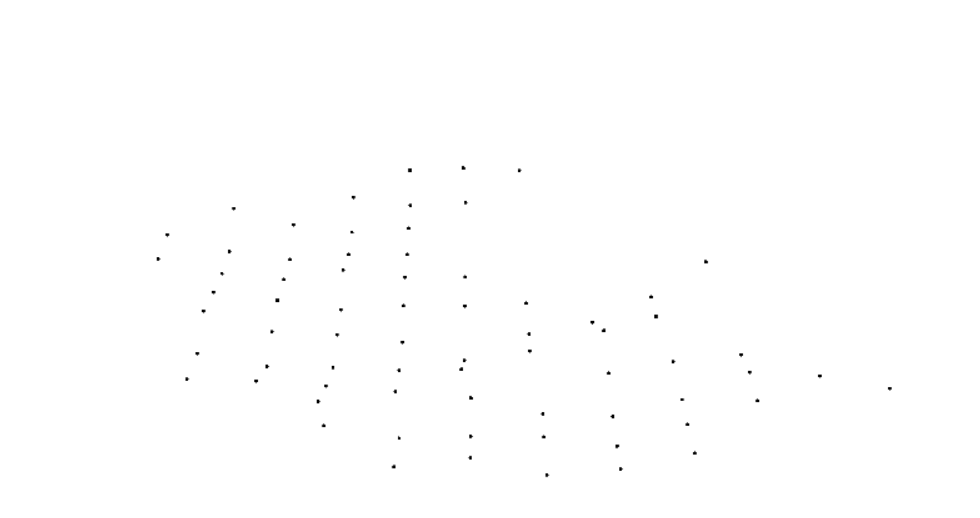
Я также могу построить точки в 3D, используя points3d,
Я был в состоянии поместить их в один сюжет, используя points3d с add=TRUE однако точки и матрица высот находятся далеко друг от друга.
В приведенном ниже коде я также попытался изменить это на фрейм пространственных данных, но rgl не похоже на это.
Можно ли построить их вместе с точками, расположенными над ЦМР?
Я искал и искал решение для этого.
Вот код R, который я использовал до сих пор:
> library(raster)
> library(rgdal)
> library(maptools)
> library(rgeos)
> library(lattice)
> library(latticeExtra)
> library(sp)
> library(rasterVis)
> library(rgl)
>
> # taking data read from a .csv of UTM and elevation values
>
> Points.Sp <- data.frame(Points=Rawdata$PointName, UTM.N=Rawdata$UTM.N, UTM.W=Rawdata$UTM.W, Elevation=Rawdata$Elevation)
> Points.Sp <- unique(Points.Sp) #weeding out duplicates
> Points.Sp <- Points.Sp[,c(3,2,4)] #getting rid of point names # I realize this looks messy but it gets what I want
> head(Points.Sp)
    UTM.W   UTM.N Elevation
1  275815 3879223      1340
8  274813 3879727      1325
29 275312 3879727      1258
45 275812 3879724      1169
66 276313 3879727      1067
75 276813 3879727      1208
>
> dem.in <- raster("D:/Thesis/SouthernApps/Coweeta/Coweeta/DEM_30m_wgs84.img") # reading in DEM
> plot(dem.in) # check in 2D # takes a long time very large, need to crop
>
> dem.crop <- crop(dem.in, c(272000, 282000, 3878000, 3884000))
> plot(dem.crop) # check in 2D, looks good.
>
> plot3D(dem.crop) # plot in 3D looks like exactly what I want
>
> points3d(Points.Sp, pch=19, cex=2, col="black", add=TRUE) # adds the points to plot but in wrong place
>
> #attempting to set a CRS in case this is the problem.
> coordinates(Points.Sp)=c(1,2)
> proj4string(Points.Sp)=CRS("++proj=utm +zone=17") # set CRS
> str(Points.Sp)
Formal class 'SpatialPointsDataFrame' [package "sp"] with 5 slots
  ..@ data       :'data.frame': 71 obs. of  1 variable:
  .. ..$ Elevation: int [1:71] 1340 1325 1258 1169 1067 1208 1256 1089 1031 959 ...
  ..@ coords.nrs : num [1:2] 1 2
  ..@ coords     : num [1:71, 1:2] 275815 274813 275312 275812 276313 ...
  .. ..- attr(*, "dimnames")=List of 2
  .. .. ..$ : chr [1:71] "1" "8" "29" "45" ...
  .. .. ..$ : chr [1:2] "UTM.W" "UTM.N"
  ..@ bbox       : num [1:2, 1:2] 274309 3878440 279876 3883732
  .. ..- attr(*, "dimnames")=List of 2
  .. .. ..$ : chr [1:2] "UTM.W" "UTM.N"
  .. .. ..$ : chr [1:2] "min" "max"
  ..@ proj4string:Formal class 'CRS' [package "sp"] with 1 slot
  .. .. ..@ projargs: chr "+proj=utm +zone=17 +ellps=WGS84"
>
> # trying this a different way after setting CRS
> x <- Points.Sp@coords[1:71,1]
> y <- Points.Sp@coords[1:71,2]
> z <- Points.Sp@data$Elevation
> m <- data.frame(x=x,y=y,z=z)
>
> plot3D(dem.crop) #again, plot in 3D looks like exactly what I want
> points3d(m, pch=19, cex=2, col="black", add=TRUE) # still adds the points to plot but in wrong place
Этот код воспроизводит проблему.
## define a Raster object
data(volcano)
r <- raster(volcano)
extent(r) <- c(0, 610, 0, 870)

## extract sample points
xy <- sampleRandom(r1, 100, xy = TRUE)
r1<-data.frame(x=seq(0, 500, length=(71)), y=seq(0, 500, length=(71)), z=seq(0,500, length=(71)))

## display them
plot3D(r, adjust = FALSE)

points3d(r1, add=TRUE)
2 ответа
## define a Raster object
data(volcano)
r <- raster(volcano)
extent(r) <- c(0, 610, 0, 870)

## extract sample points
xy <- sampleRandom(r1, 100, xy = TRUE)

#must extract the data from the raster and recombine with the xy data.
#I don't know why this is different than simply using the raw values but it
#provides the desired effect.

r1<-data.frame(x=seq(0, 500, length=(71)), y=seq(0, 500, length=(71)))
z<-extract(r, r1)
r1$z<-z
## display them
plot3D(r, adjust = FALSE)

points3d(r1, add=TRUE)

#points now lie flat on 3d image.Как задокументировано на странице справки, и ось x, и ось y регулируются значениями z. Вы можете отключить эту настройку по умолчанию с adjust = FALSE:
library(rgl)
library(rasterVis)

## define a Raster object
data(volcano)
r <- raster(volcano)
extent(r) <- c(0, 610, 0, 870)

## extract sample points
xy <- sampleRandom(r, 100, xy = TRUE)

## display them
plot3D(r, adjust = FALSE)
points3d(xy)


