R Пузырьковая диаграмма: метки перекрываются
Попытка закодировать функцию, которая возвращает пузырьковую диаграмму из агрегированных данных.
Я передаю ему столбец data.frame в "agg".
aggs2 <- function(agg, deporur=0, all=TRUE){

  ##create aggregate from library data

  agg1 <- aggregate(agg, by=list(NoNA$IMD_NATIONAL_QUINTILE, NoNA$UR),
                    FUN=function(x) c(mn=mean(x), n=length(x)))

  ##bind into a dataframe

  agg1 <- cbind(agg1[,1:2], agg1[,3])

  ##add column holding values of Deprivation Quantile and Urban/Rural status

  agg1$NewCol <- do.call(paste, c("Deprivation Quantile", agg1[c("Group.1", "Group.2")],
                                  sep = " "))

  ##set column names

  colnames(agg1) <- c("Deprivation", "Urban and Rural", "Mean", "Count", "DepUR")

  ##remove categories with low counts

  if(all==FALSE){

    agg1 <- subset(agg1, agg1$Count > 9)

  }

  ##order data.frame by mean

  agg1 <- agg1[order(agg1$Mean, decreasing=TRUE),]

  ##create bubble chart
  if(deporur==1){

    radius3 <- sqrt(agg1$Count/pi)

    symbols(factor(agg1$DepUR), agg1$Mean, circles=radius3, inches=0.35,
            xlim=c(0,10.0), ylim=c(min(agg1$Mean-0.25),10.0), fg="white", bg="purple",
            xlab="Deprivation Quantile and Urban/Rural Status", ylab="Mean Response")

    text(factor(agg1$DepUR), agg1$Mean-.1, agg1$DepUR, cex=0.7)
  }

  #return ordered dataframe
  agg1

}
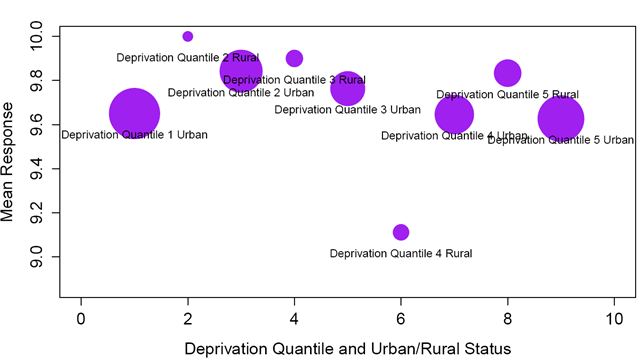
Это возвращает отсортированный data.frame по среднему значению и следующую диаграмму:
Поскольку эта функция должна будет создавать графики из различных документов и столбцов, я хотел бы закодировать ее так, чтобы метки не перекрывали пузырьки или другие метки.
Я посмотрел на библиотеку directlabels, но не смог понять, как правильно ее кодировать.
Буду очень признателен за любую помощь.
1 ответ
Решение
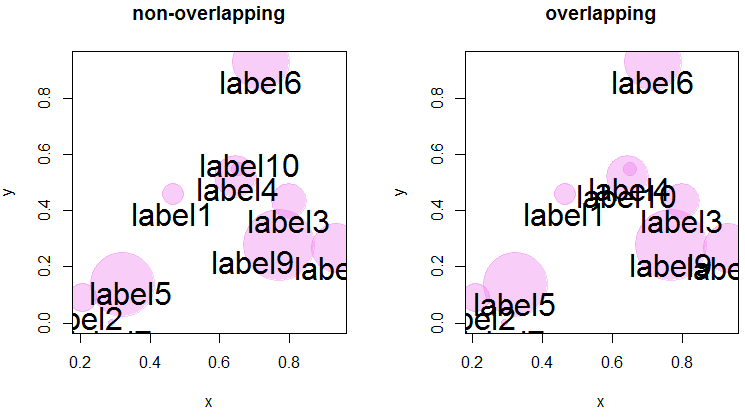
Я не знаю ни одного решения для неперекрывающихся ярлыков по отношению к другим ярлыкам И другим кругам. тем не менее, wordcloud::textplot может быть отправной точкой:
library(wordcloud)
set.seed(8)
df <- data.frame(x = runif(10), y = runif(10), size = sample(10:20, 10), lab = paste0("label", 1:10))
par(mfrow = c(1,2))
with(df, {
  plot(x, y, cex = size, pch = 19, col = adjustcolor("violet", alpha.f = .4), main = "non-overlapping")
  textplot(x, y, lab, new = FALSE, show.lines = FALSE, cex = 2)
  plot(x, y, cex = size, pch = 19, col = adjustcolor("violet", alpha.f = .4), main = "overlapping")
  text(x, y, lab, cex = 2)
})

