Построить и построить 2D-гистограмму Matplotlib в полярных координатах, используя многочлены Лежандра
Я пытаюсь построить распределение:

Это распределение температуры внутри сферы радиуса (a), верхняя полусфера которой удерживается при T=1, а нижняя полусфера - при T=0 (игнорируем разрыв на границе между двумя полушариями), а P_l - многочлены Лежандра. первого рода.
import pylab as pl
from scipy.special import eval_legendre as Leg
import math,sys

def sumTerm(a,r,theta,l):
    """
    Compute term of sum given radius of sphere (a),
    y and z coordinates, and the current index of the
    Legendre polynomials (l) over the entire range
    where these polynomials are orthogonal [-1,1].
    """
    xRange = pl.arange(-0.99,1.0,0.01)
    x = pl.cos(theta)
    # correct for scipy handling negative indices incorrectly
    lLow = l-1
    lHigh = l+1
    if lLow < 0:
        lLow = -lLow-1
    return 0.5*((r/a)**l)*Leg(l,x)*(Leg(lLow,0)-Leg(lHigh,0))

def main():

    n = 10      # number of l terms to expand to
    a = 1.0     # radius of sphere

    # generate r, theta values
    aBins = pl.linspace(0, 2*pl.pi, 360)      # 0 to 360 in steps of 360/N.
    rBins = pl.linspace(0, 1, 50)
    theta,r = pl.meshgrid(aBins, rBins)

    tempProfile = pl.zeros([50,360])
    for nr,ri in enumerate(rBins):
        for nt,ti in enumerate(aBins):
            temp = 0.0
            for l in range(n):
                temp += sumTerm(a, ri, ti, l)
            tempProfile[nr,nt] = temp

    # plot the Temperature profile
    pl.imshow(tempProfile)
    pl.colorbar()
    pl.axes().set_aspect('equal')
    pl.show()

if __name__=='__main__':
    main()
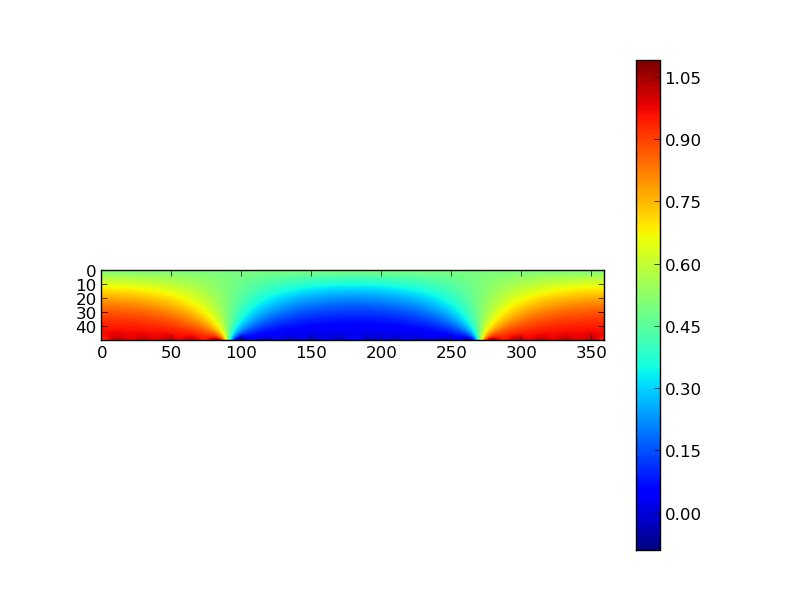
Это дает следующий сюжет:

Это выглядит хорошо, но как я могу отобразить это в полярных координатах?
1 ответ
Решение
Хорошо, я понял это. Вот мое решение (я чувствую себя странно, давая свое собственное решение для этого).
# =============================================================================
# Plot central cross-section of sphere under steady-state conditions
# where the temperature on upper hemisphere is T=T_0 and the lower
# hemisphere is held at T=0.  This is an expansion in Legendre polynomials.
#
# Author:           Max Graves
# Last Revised:     8-OCT-2013
# =============================================================================

import pylab as pl

from scipy.special import eval_legendre as Leg
import math,sys

def sumTerm(a,r,theta,l):
    """
    Compute term of sum given radius of sphere (a),
    y and z coordinates, and the current index of the
    Legendre polynomials (l) over the entire range
    where these polynomials are orthogonal [-1,1].
    """
    xRange = pl.arange(-0.99,1.0,0.01)
    x = pl.cos(theta)
    # correct for scipy handling negative indices incorrectly
    lLow = l-1
    lHigh = l+1
    if lLow < 0:
        lLow = -lLow-1
    return 0.5*((r/a)**l)*Leg(l,x)*(Leg(lLow,0)-Leg(lHigh,0))

def main():

    n = 20      # number of l terms to expand to
    a = 1.0     # radius of sphere

    # generate r, theta values
    aBins = pl.linspace(0, 2*pl.pi, 360)      # 0 to 360 in steps of 360/N.
    rBins = pl.linspace(0, 1, 50)
    theta,r = pl.meshgrid(aBins, rBins)

    tempProfile = pl.zeros([50,360])
    for nr,ri in enumerate(rBins):
        print nr
        for nt,ti in enumerate(aBins):
            temp = 0.0
            for l in range(n):
                temp += sumTerm(a, ri, ti, l)
            tempProfile[nr,nt] = temp

    # plot the Temperature profile
    fig, ax = pl.subplots(subplot_kw=dict(projection='polar'))
    pax = ax.pcolormesh(theta, r, tempProfile)
    ax.set_theta_zero_location("N") # 'north' location for theta=0
    ax.set_theta_direction(-1)      # angles increase clockwise
    fig.colorbar(pax)

    pl.show()

if __name__=='__main__':
    main()
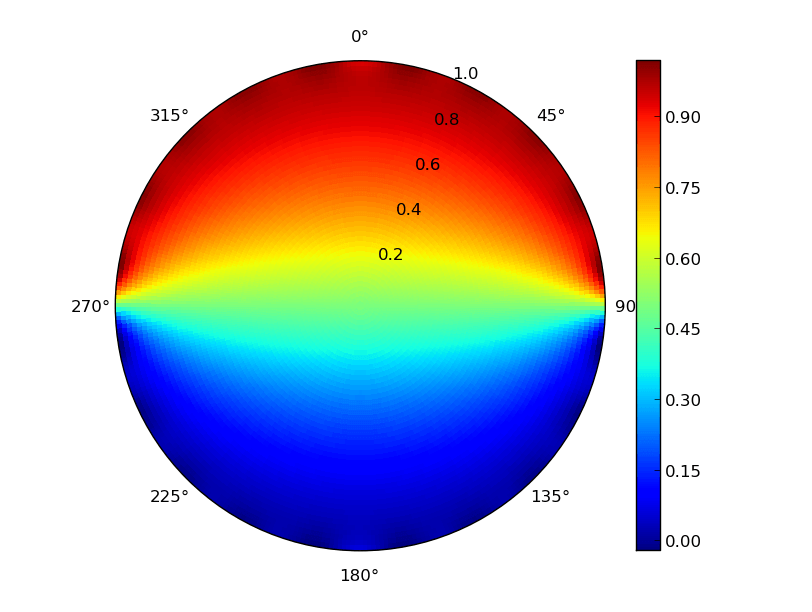
что дает следующий участок:
