Автоматически изменять размеры графиков ggplot2 в flexdashboard
У меня есть flexdashboard с одним кадром. Теперь я столкнулся с двумя проблемами:
Во-первых, как я могу изменить размер заголовка кадра ("Пример")?
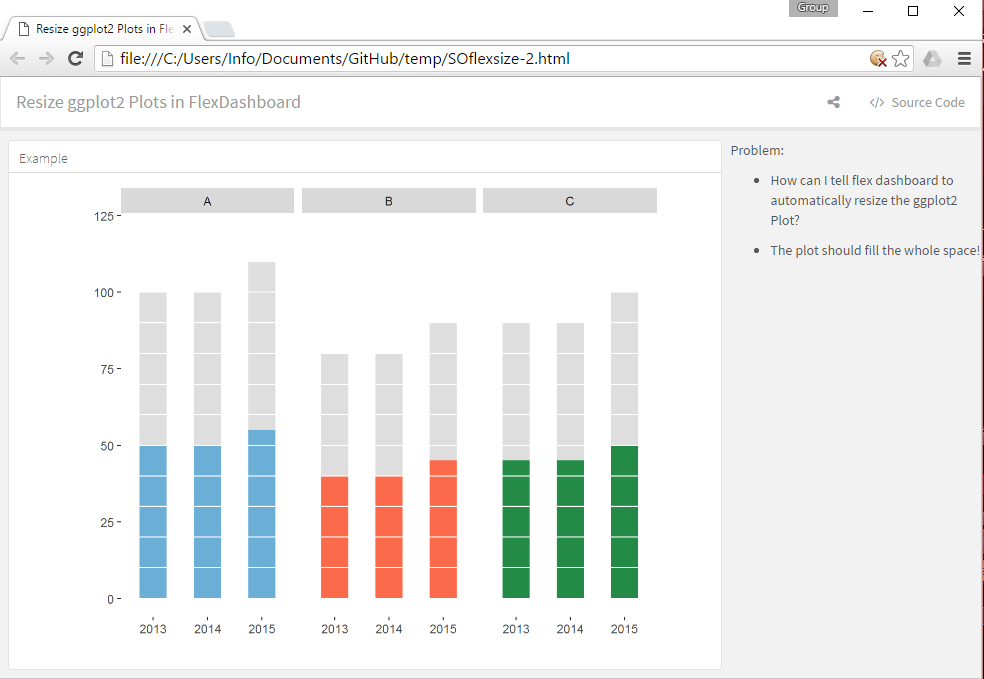
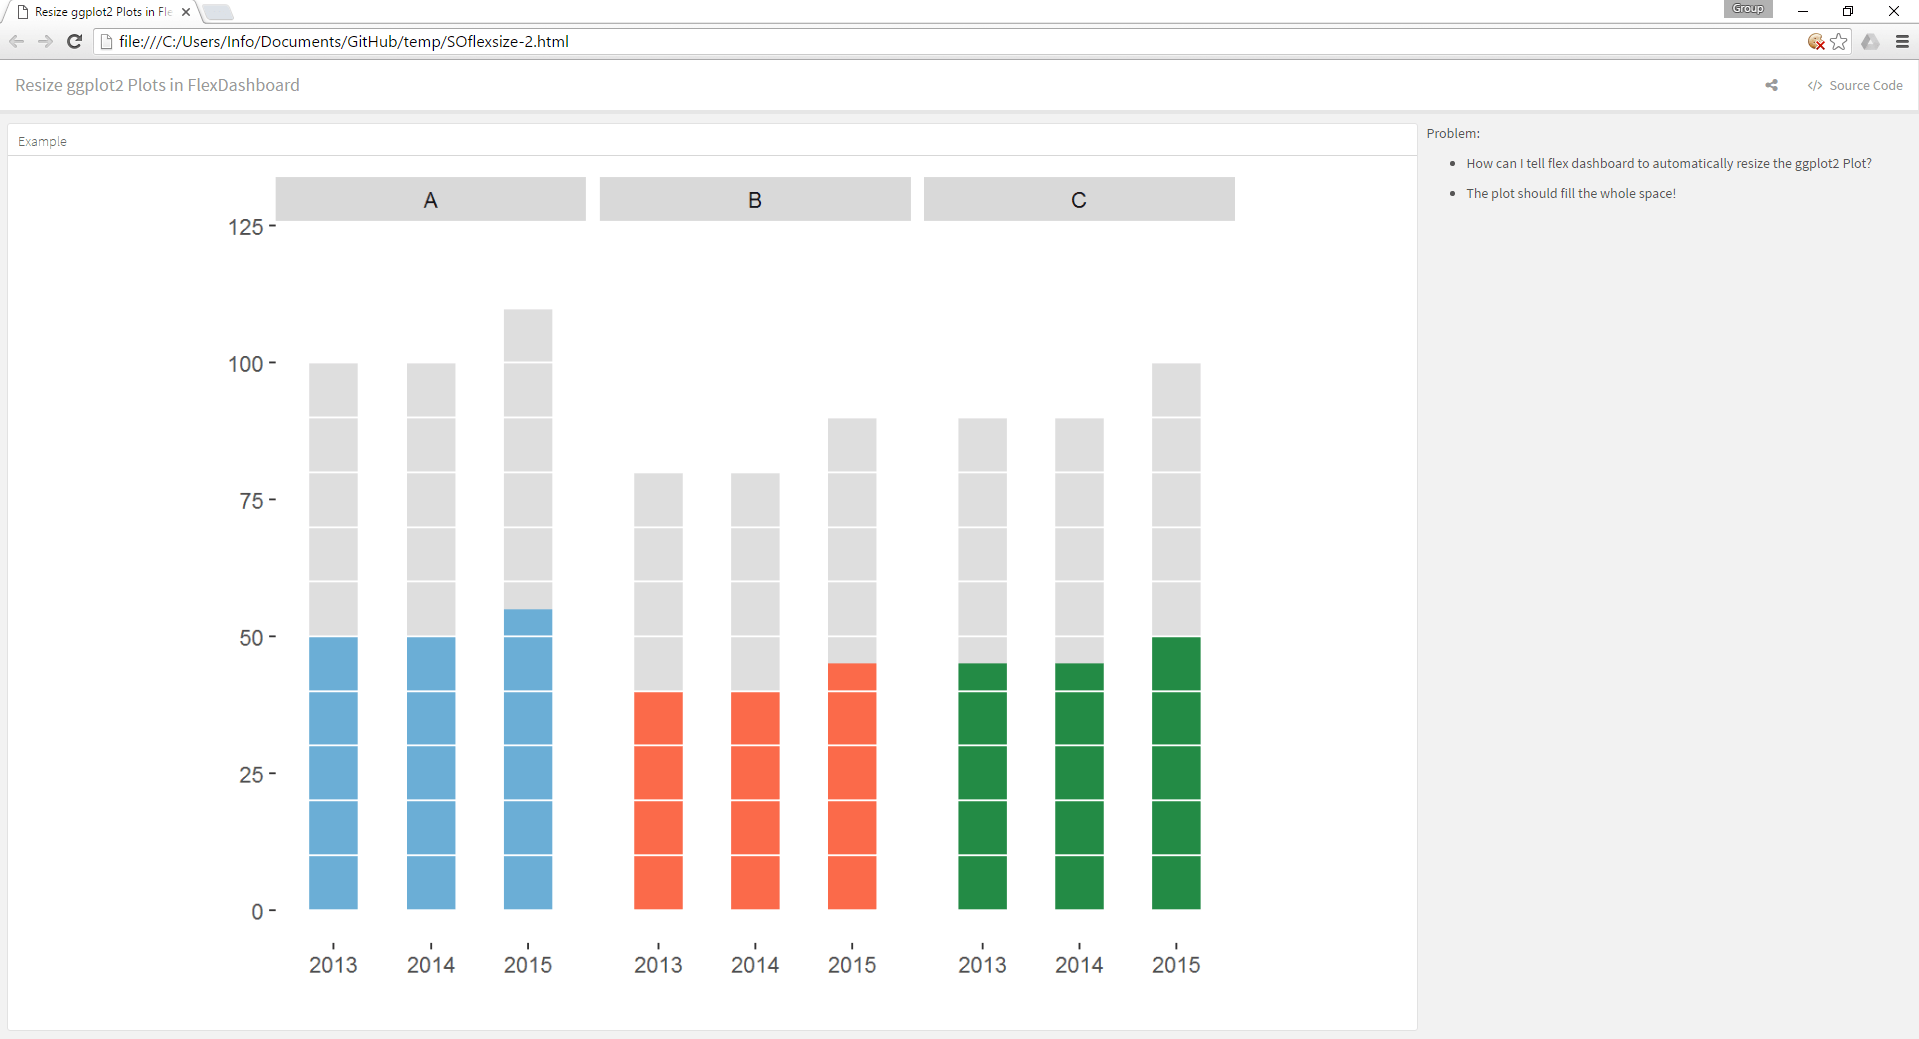
Во-вторых, панель инструментов автоматически изменяет размеры в браузере. Тем не менее, сюжет ggplot2 не делает. Как я могу сказать flexdashboard, чтобы изменить размер этого графика автоматически?
---
title: "Resize ggplot2 Plots in FlexDashboard"
output:
  flexdashboard::flex_dashboard:
    storyboard: true
    theme: lumen
    social: menu
    source: embed
---

```{r setup, include=FALSE}
require(flexdashboard)
require(ggplot2)
df <- data.frame(year = c("2013", "2014", "2015", "2013", "2014", "2015", "2013", "2014", "2015"),
                 cat = c("A", "A", "A", "B", "B", "B", "C", "C", "C"),
                 freqA = c(100, 100, 110, 80, 80, 90, 90, 90, 100),
                 freqB = c(50, 50, 55, 40, 40, 45, 45, 45, 50))
```

### Example

```{r}
ggplot(df, aes(x = year, weight = freqA)) +
        geom_bar(position="dodge", alpha = .2, width=.5) +
        # add and overlay elements
        geom_bar(aes(x = year, weight = freqB, fill = cat),
                 position = "dodge", width=.5) +
        scale_fill_manual(values = c("#6baed6", "#fb6a4a", "#238b45")) +
        # add hlines for waffle-design
        geom_hline(yintercept=seq(0, 120, by = 10), col = 'white') +
        # facet display - 1 row, 3 columns
        facet_grid(. ~ cat) +
        # delete labels of x- and y-axis
        xlab("") + ylab("") +
        # blank background and now grids and legend
        theme(panel.grid.major.x = element_blank(), panel.grid.major.y = element_blank(),
              panel.grid.minor.y = element_blank(),
              panel.background = element_blank(), legend.position = "none",
              axis.text.x = element_text(angle = 0, hjust = 0.5))
```


***

Problem:

- How can I tell flex dashboard to automatically resize the ggplot2 Plot?

- The plot should fill the whole space!
2 ответа
feder80, я только начинаю с 'flexdashboard's', но как насчет использования столбца, а не макета раскадровки? Затем вы можете установить размер столбцов, и он кажется более чувствительным к изменению размеров (но он не будет растягивать диаграмму до каждого угла).
Увидеть:
ширина столбца или заданная глубина: http://rmarkdown.rstudio.com/flexdashboard/using.html
другие макеты: http://rmarkdown.rstudio.com/flexdashboard/using.html
На этих страницах отмечается, что "по умолчанию заголовки уценки уровня 2 (------------------) в сводных панелях определяют столбцы, а отдельные диаграммы располагаются вертикально в каждом столбце".
Обратите внимание, что существуют специальные настройки по умолчанию для мобильных устройств, если вы просматриваете их на небольших экранах, которые ограничивают размеры.
КОД
---
title: "Resize ggplot2 Plots in FlexDashboard v2"
output:
  flexdashboard::flex_dashboard:
    theme: lumen
    social: menu
    source: embed
---

```{r setup, include=FALSE}
require(flexdashboard)
require(ggplot2)
df <- data.frame(year = c("2013", "2014", "2015", "2013", "2014", "2015", "2013", "2014", "2015"),
                 cat = c("A", "A", "A", "B", "B", "B", "C", "C", "C"),
                 freqA = c(100, 100, 110, 80, 80, 90, 90, 90, 100),
                 freqB = c(50, 50, 55, 40, 40, 45, 45, 45, 50))
```

Column1
-------

### Example


```{r}


  ggplot(df, aes(x = year, weight = freqA)) +
    geom_bar(position="dodge", alpha = .2, width=.5) +
    # add and overlay elements
    geom_bar(aes(x = year, weight = freqB, fill = cat),
             position = "dodge", width=.5) +
    scale_fill_manual(values = c("#6baed6", "#fb6a4a", "#238b45")) +
    # add hlines for waffle-design
    geom_hline(yintercept=seq(0, 120, by = 10), col = 'white') +
    # facet display - 1 row, 3 columns
    facet_grid(. ~ cat) +
    # delete labels of x- and y-axis
    xlab("") + ylab("") +
    # blank background and now grids and legend
    theme(panel.grid.major.x = element_blank(), panel.grid.major.y = element_blank(),
          panel.grid.minor.y = element_blank(),
          panel.background = element_blank(), legend.position = "none",
          axis.text.x = element_text(angle = 0, hjust = 0.5))

```


Column2{data-width=200}
-------

Problem:

- How can I tell flex dashboard to automatically resize the ggplot2 Plot?

- The plot should fill the whole space!
ФОТОГРАФИИ С ИСПОЛЬЗОВАНИЕМ РАЗЛИЧНОГО РАЗМЕРА ОКНА БРАУЗЕРА
Это не очевидно, но по тексту справа видно, что это разное количество пикселей в ширину.
Во- первых, настроить размер заголовка. К сожалению, макет раскадровки немного менее универсален с точки зрения опций, которые вы можете указать в основной части кода R. Однако вы можете переопределить настройки по умолчанию, используя код css в документе уценки. Я изменил приведенный здесь код: Измените CSS Flexdashboard в R , чтобы он соответствовал вашему вопросу (см. ниже).
Во- вторых, изменение размера диаграмм. Использование спецификаций fig.width =12, fig.height= 5 в коде позволит вам настроить размер вашего графика и изменить его размер при уменьшении (хотя не всегда будет полностью соответствовать окну). Если это соответствует цели, plotly может предложить больше с точки зрения размера диаграммы, чем ggplot2.
        ---
title: "Resize ggplot2 Plots in FlexDashboard"
output:
  flexdashboard::flex_dashboard:
    storyboard: true
    theme: lumen
    social: menu
    source: embed
---
Some commentary about Frame 1.

```{r setup, include=FALSE}
require(flexdashboard)
require(ggplot2)
df <- data.frame(year = c("2013", "2014", "2015", "2013", "2014", "2015", "2013", "2014", "2015"),
                 cat = c("A", "A", "A", "B", "B", "B", "C", "C", "C"),
                 freqA = c(100, 100, 110, 80, 80, 90, 90, 90, 100),
                 freqB = c(50, 50, 55, 40, 40, 45, 45, 45, 50))
```

### Example

```{r,fig.width = 12, fig.height= 5}

ggplot(df, aes(x = year, weight = freqA)) +
        geom_bar(position="dodge", alpha = .2, width=.5) +
        # add and overlay elements
        geom_bar(aes(x = year, weight = freqB, fill = cat),
                 position = "dodge", width=.5) +
        scale_fill_manual(values = c("#6baed6", "#fb6a4a", "#238b45")) +
        # add hlines for waffle-design
        geom_hline(yintercept=seq(0, 120, by = 10), col = 'white') +
        # facet display - 1 row, 3 columns
        facet_grid(. ~ cat) +
        # delete labels of x- and y-axis
        xlab("") + ylab("") +
        # blank background and now grids and legend
        theme(panel.grid.major.x = element_blank(), panel.grid.major.y = element_blank(),
              panel.grid.minor.y = element_blank(),
              panel.background = element_blank(), legend.position = "none",
              axis.text.x = element_text(angle = 0, hjust = 0.5))
```


***

Problem:

- How can I tell flex dashboard to automatically resize the ggplot2 Plot?

- The plot should fill the whole space!


```{css css_formatting}
.storyboard-nav {
    box-sizing: border-box;
    width: 100% !important; /* This prevents JS transformation on width */
    height: auto; /* This overrides the height */
}

.storyboard-nav .sbnext, .storyboard-nav .sbprev {
    height: auto; /* This overrides the height */
    font-size: 3rem;
}

.storyboard-nav .sbframelist {
    height: auto; /* This overrides the height */
}

.storyboard-nav .sbframelist ul {
    box-sizing: border-box;
    width: 100% !important; /* This prevents JS transformation on width */
    height: auto; /* This overrides the height */
}

.storyboard-nav .sbframelist ul li {
    height: auto; /* This overrides the height */
    width: auto; /* This overrides the width */
    font-size: 6rem;/* This determines the size of the text in the box */
}


```

