Длинные и широкоформатные эквиваленты в ggraph
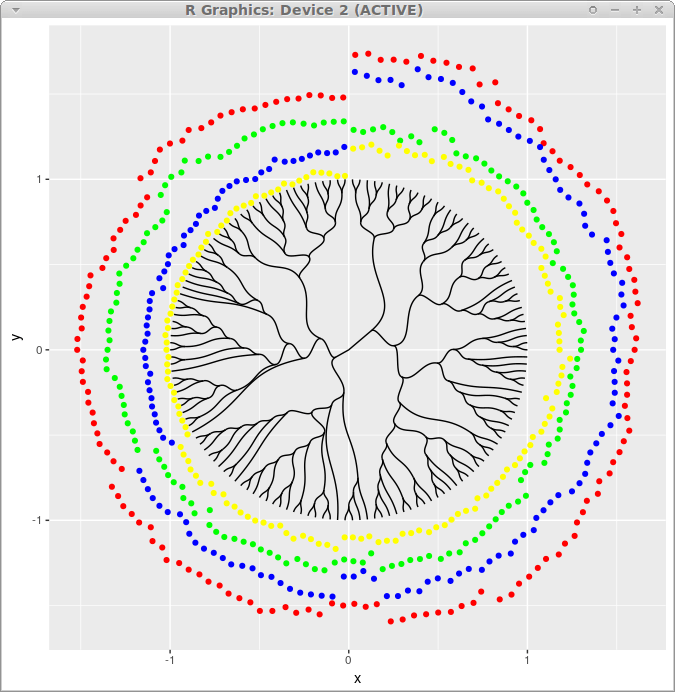
Я пытаюсь сделать график похож на это:
library(tidyverse)
library(ggraph)
iris_g <- den_to_igraph(as.dendrogram(hclust(dist(iris[1:4]))))
xy_expand <- function(xy, expand) xy * (1 + expand / 10)
ord <- match(as.numeric(V(iris_g)$label), seq_len(nrow(iris)))
V(iris_g)$Petal.Length <- iris$Petal.Length[ord]
V(iris_g)$Petal.Width  <- iris$Petal.Width[ord]
V(iris_g)$Sepal.Length <- iris$Sepal.Length[ord]
V(iris_g)$Sepal.Width  <- iris$Sepal.Width[ord]
V(iris_g)$Species      <- iris$Species[ord]

ggraph(iris_g, layout = "dendrogram", circular = TRUE) +
  geom_edge_diagonal() +
  geom_node_point(aes(filter = leaf,
                      x = xy_expand(x, Sepal.Length),
                      y = xy_expand(y, Sepal.Length)),
                  color = "red") +
  geom_node_point(aes(filter = leaf,
                      x = xy_expand(x, Sepal.Width),
                      y = xy_expand(y, Sepal.Width)),
                  color = "green") +
  geom_node_point(aes(filter = leaf,
                      x = xy_expand(x, Petal.Length),
                      y = xy_expand(y, Petal.Length)),
                  color = "blue") +
  geom_node_point(aes(filter = leaf,
                      x = xy_expand(x, Petal.Width),
                      y = xy_expand(y, Petal.Width)),
                  color = "yellow")
 Я хотел бы уточнить
 aes(color = Trait) так что раскраска хорошо вписывается в остальную часть рисунка, но я не могу понять, существует ли эквивалент длинного формата данных в ggraph
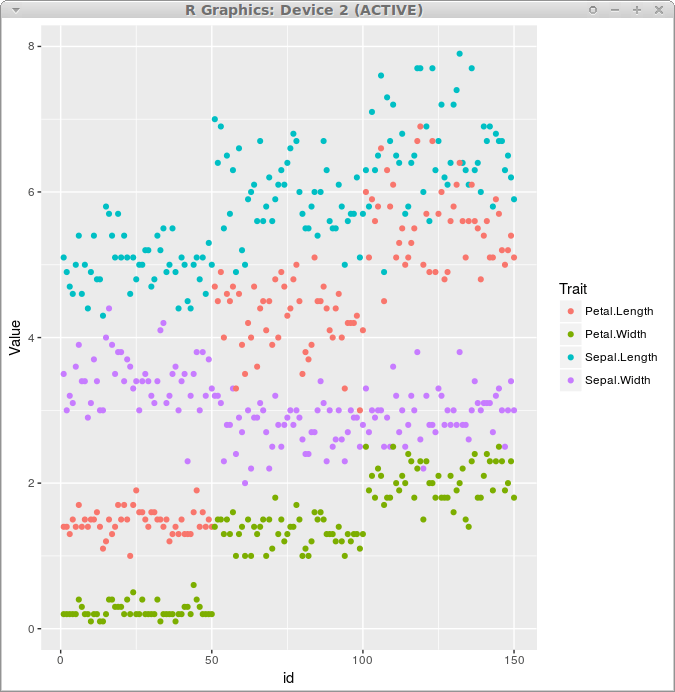
Эквивалент того, что я хочу сделать в ggplot было бы:
library(ggplot2)
iris %>%
  mutate(id = seq_len(nrow(iris))) %>%
  gather(key = Trait, value = Value, Sepal.Length:Petal.Width) %>%
  ggplot(aes(x = id, y = Value, color = Trait)) +
  geom_point()
