Увеличьте поля для меток повернутых осей с помощью Crossfilter
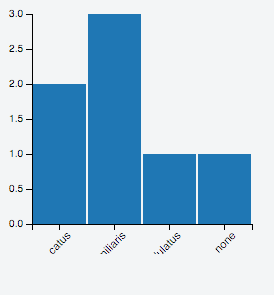
Мне нужно увеличить пространство для меток оси, которые были повернуты. Код ниже иллюстрирует, и вот рабочий jsfiddle. Это возможно с кроссфильтром, или мы должны попасть в d3?
HTML
<script src="https://rawgit.com/square/crossfilter/master/crossfilter.js"></script>
<script src="https://d3js.org/d3.v3.js"></script>
<script src="https://rawgit.com/dc-js/dc.js/develop/dc.js"></script>

<span>
  <div id="petchart"></div>
</span>
JS
j = [{'pet': 'Felis catus'}, {'pet': 'Canis lupus familiaris'}, {'pet': 'none'},
        {'pet': 'Felis catus'}, {'pet': 'Melopsittacus undulatus'},
    {'pet': 'Canis lupus familiaris'}, {'pet': 'Canis lupus familiaris'}];

cf = crossfilter(j);
pets_chart = dc.barChart("#petchart");
petDimension = cf.dimension(function(d) {return d.pet;});
petCountGroup = petDimension.group();

pets_chart
  .dimension(petDimension)
  .group(petCountGroup)
  .x(d3.scale.ordinal().domain(["Felis catus","Canis lupus familiaris","Melopsittacus undulatus","none"]))
  .xUnits(dc.units.ordinal)
    .width(300).height(250)
  .colors(['#1f77b4']).colorAccessor(function(d, i){ return i; })
  .xAxis().ticks(2);

dc.renderAll();
CSS
g .x.axis text {
    text-anchor: end !important;
    transform: rotate(-45deg);
    font-size: 0.7em;
}
2 ответа
Решение
Также возможно установить большее нижнее поле с помощью dc.js:
pets_chart
   .margins({ top: 10, left: 30, right: 10, bottom: 100 })
Это возможно с помощью CSS:
.dc-chart svg {
  overflow: visible
}
