Вставка гиперссылок в метки узлов в DiagrammeR
Я хотел бы иметь возможность создавать блок-схемы с DiagrammeR в R, чтобы я мог экспортировать SVG через devtools::install_github('rich-iannone/DiagrammeRsvg') пакет.
Мои потоковые диаграммы должны содержать гиперссылки в некоторых узлах, к сожалению, я не могу найти приемлемый способ создания ярлыков узлов с функционированием <a> теги. Вот разные методы, которые я пробовал:
Русалочка
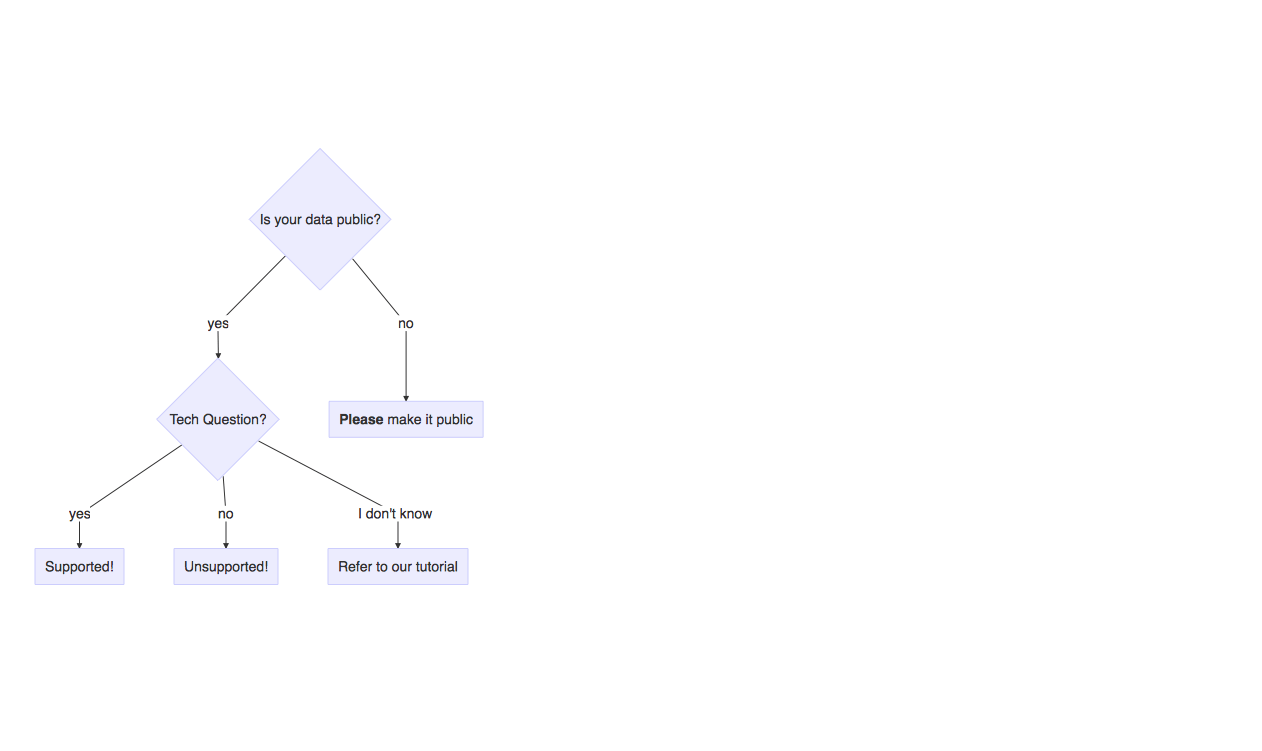
С помощью DiagrammeR(diagram = "", type = "mermaid") можно использовать теги HTML в метках узла:
library("DiagrammeR")
DiagrammeR("graph TB;
           A{Is your data public?} -- yes -->C;
           A -- no -->B[<center><b>Oxshef: dataviz</b> only supports researchers <br> in the creation of interactive data visualisations that public</center>];
           C{<center>Please make it public?</center>};
           D[<center>Supported!</center>];
           E[<center>Unsupported!</center>];
           F[Refer to our tutorial];
           C -- yes -->D;
           C -- no -->E;
           C -- I don't know -->F")
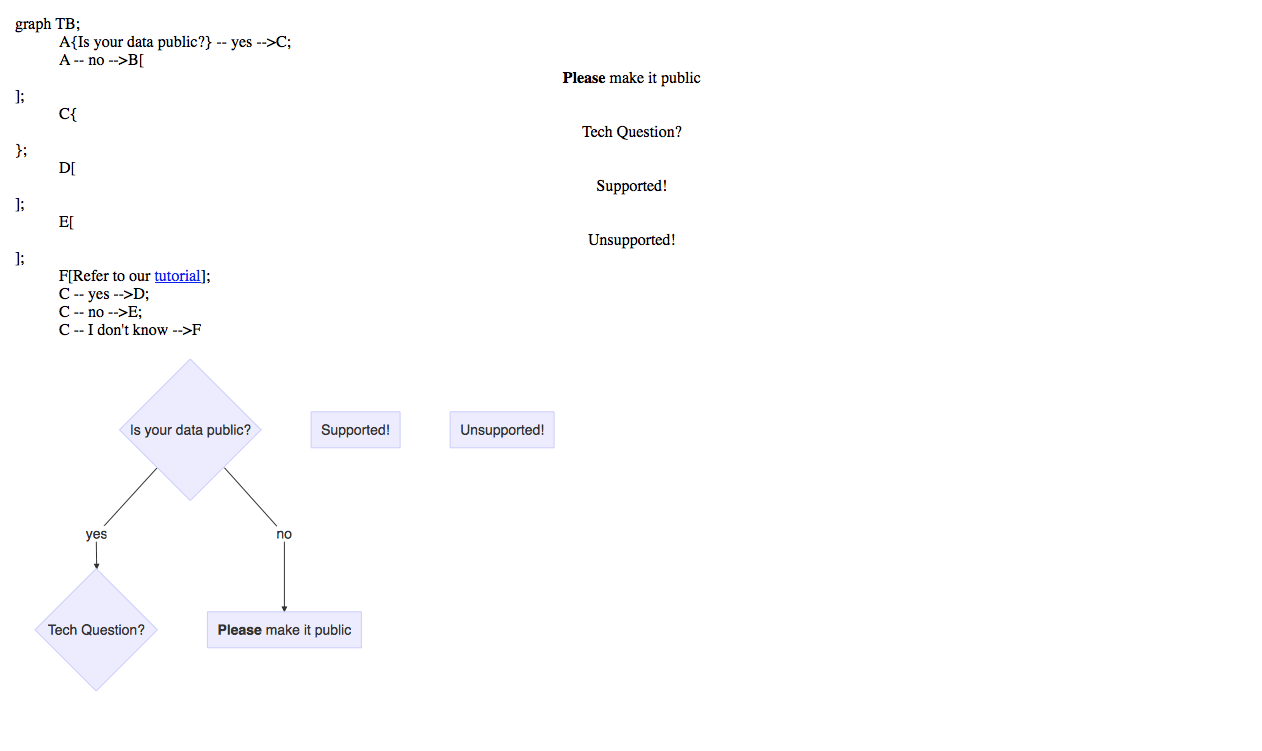
Но использовать <a> тег нам нужно использовать = над которым парсер рвет:
DiagrammeR("graph TB;
           A{Is your data public?} -- yes -->C;
           A -- no -->B[<center><b>Oxshef: dataviz</b> only supports researchers <br> in the creation of interactive data visualisations that public</center>];
           C{<center>Please make it public?</center>};
           D[<center>Supported!</center>];
           E[<center>Unsupported!</center>];
           F[Refer to our <a href='http://google.com'>tutorial</a>];
           C -- yes -->D;
           C -- no -->E;
           C -- I don't know -->F")
grViz
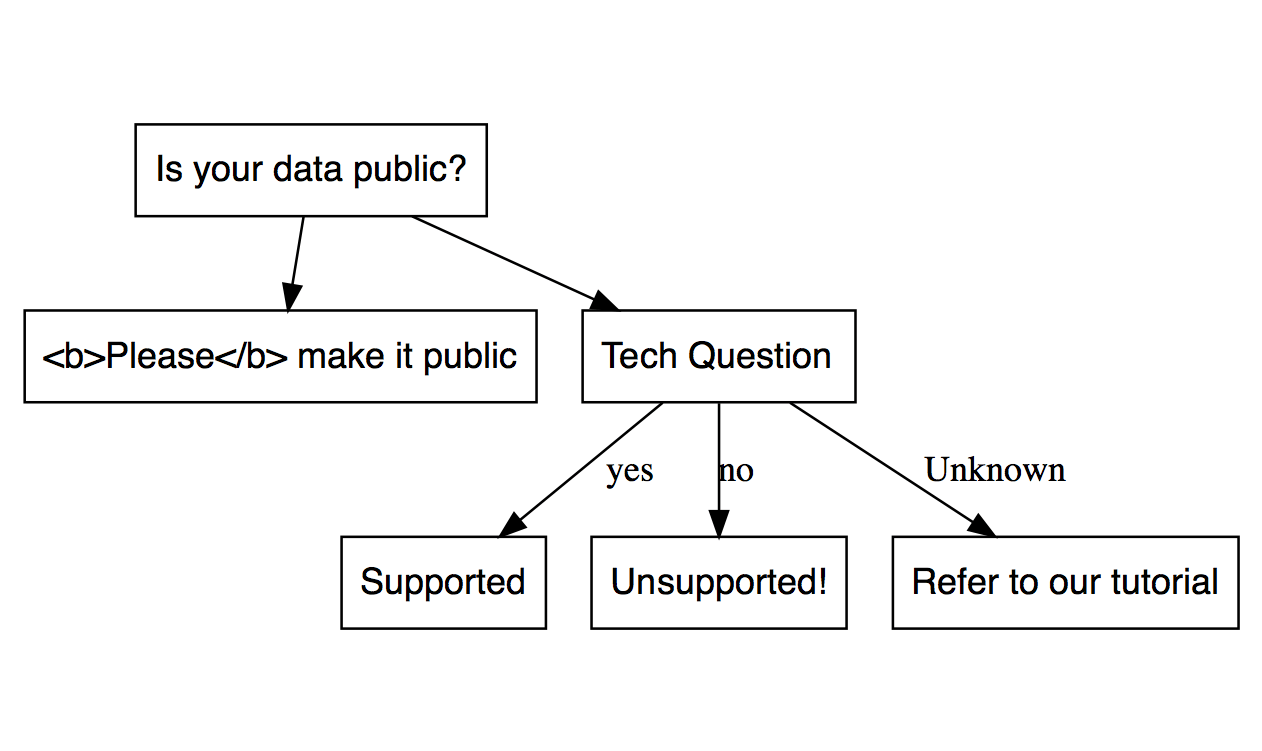
Вот та же самая блок-схема, что и выше, но со всем html-кодом, раздетым и преобразованным в grViz:
grViz("
digraph boxes_and_circles {

      # a 'graph' statement
      graph [overlap = true, fontsize = 10]

      # several 'node' statements
      node [shape = box,
      fontname = Helvetica]
      A [label = 'Is your data public?']; B [label = 'Please make it public'];
      C [label = 'Tech Question']; D [label = 'Supported' ];
      E [label = 'Unsupported!']; F [label = 'Refer to our tutorial']

      # several 'edge' statements
      A->B A->C C->D [label = 'yes'] C->E [label = 'no'] C->F [label = 'Unknown']
      }
      ")
Это не поддерживает теги HTML:
grViz("
digraph boxes_and_circles {

      # a 'graph' statement
      graph [overlap = true, fontsize = 10]

      # several 'node' statements
      node [shape = box,
      fontname = Helvetica]
      A [label = 'Is your data public?']; B [label = '<b>Please</b> make it public'];
      C [label = 'Tech Question']; D [label = 'Supported' ];
      E [label = 'Unsupported!']; F [label = 'Refer to our tutorial']

      # several 'edge' statements
      A->B A->C C->D [label = 'yes'] C->E [label = 'no'] C->F [label = 'Unknown']
      }
      ")
create_graph
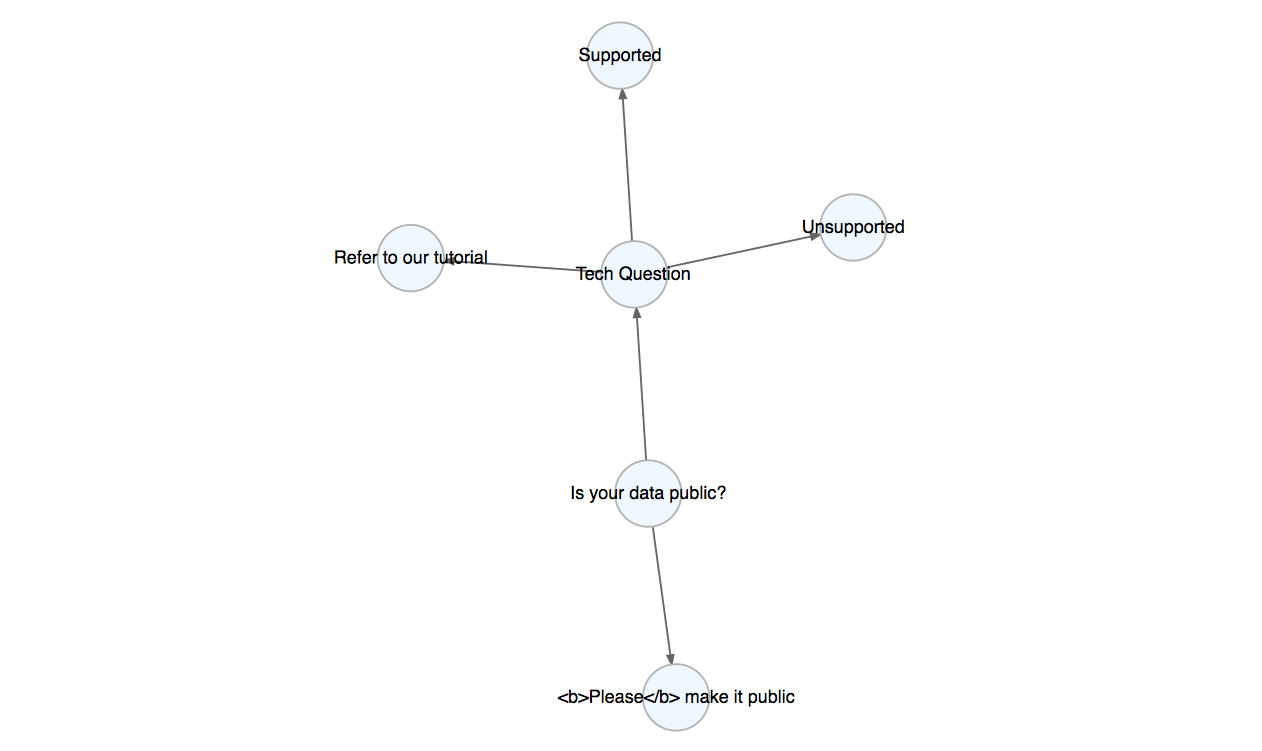
DiagrammeR также позволяет нам создать график следующим образом:
ndf_no_tags <- create_node_df(n = 6,
                              label = c("Is your data public?",
                                        "Please make it public",
                                        "Tech Question",
                                        "Supported",
                                        "Unsupported",
                                        "Refer to our tutorial"))
# Create an edge data frame (edf)
edf <- create_edge_df(from = c(1, 1, 3, 3, 3),
                      to = c(2, 3, 4, 5, 6))
ndf_no_tags %>%
  create_graph(edges_df = edf) %>%
  render_graph()
Но он избегает тегов HTML:
ndf_with_tags <- create_node_df(n = 6,
                              label = c("Is your data public?",
                                        "<b>Please</b> make it public",
                                        "Tech Question",
                                        "Supported",
                                        "Unsupported",
                                        "Refer to our tutorial"))
ndf_with_tags %>%
  create_graph(edges_df = edf) %>%
  render_graph()
1 ответ
Я понял это для функции русалки:
mermaid('
graph LR
  A-->B
  A-->C
  C-->E
  B-->D
  C-->D
  D-->F
  E-->F
  click B "http://www.github.com" "This is a link"
')
click B <link> опция требует двойных кавычек, и, к счастью, R принимает одинарные кавычки для всего блока кода русалки.


