Развернуть и свернуть с помощью sigma.js
Цель
Я пытаюсь реализовать развернуть и свернуть в sigma.js. При щелчке правой кнопкой мыши любого узла он добавляет новый узел и соединяет его ребро, но он размещается в произвольном положении.
Я хочу добавить узлы в свободное пространство, и они не должны сталкиваться или перекрываться с другими узлами. Он должен медленно расширяться с анимацией, расширяясь в области свободного пространства, как в этом примере. Связанные
Код
<!DOCTYPE html>
<html>
<head>
<title> Airlines Graph Render </title>
<script src="../build/sigma.min.js"></script>
<script src="../src/renderers/canvas/sigma.canvas.edges.curvedArrow.js"></script>
<script src="../plugins/sigma.layout.forceAtlas2/worker.js"></script>
<script src="../plugins/sigma.layout.forceAtlas2/supervisor.js"></script>
<script src="../plugins/sigma.renderers.edgeLabels/settings.js"></script>
<script src="../plugins/sigma.renderers.edgeLabels/sigma.canvas.edges.labels.curve.js"></script>
<script src="../plugins/sigma.renderers.edgeLabels/sigma.canvas.edges.labels.def.js"></script>
<script src="../plugins/sigma.renderers.edgeLabels/sigma.canvas.edges.labels.curvedArrow.js"></script>
<style>
body,html{
width: 100%;
margin: 0px;
padding: 0px;
height: 100%
}
#graph-container {
width:100%;
height: 100%;
}
</style>
</head>
<body>
<div id="graph-container"></div>
<script >
var graph = {
"nodes": [
{
"city": "Dallas",
"area": 999,
"code": 214,
"country": "USA"
},
{
"city": "Austin",
"area": 1180,
"code": 512,
"country": "USA"
},
{
"city": "New York",
"area": 1214,
"code": 646,
"country": "USA"
},
{
"city": "Washington",
"area": 176,
"code": 564,
"country": "USA"
},
{
"city": "Atlanta",
"area": 342,
"code": 518,
"country": "USA"
},
{
"city": "Huston",
"area": 1625,
"code": 281,
"country": "USA"
},
{
"city": "Chicago",
"area": 606,
"code": 312,
"country": "USA"
},
{
"city": "London",
"area": 909,
"code": 312,
"country": "England"
}
],
"edges": [
{
"key": 1,
"source": "Dallas",
"destination": "Austin",
"distance": 200,
"airlines": "British Airways",
"fare": 220
},
{
"key": 2,
"source": "Austin",
"destination": "Dallas",
"distance": 200,
"airlines": "Lufthansa",
"fare": 120
},
{
"key": 3,
"source": "Washington",
"destination": "Dallas",
"distance": 1300,
"airlines": "Lufthansa",
"fare": 300
},
{
"key": 4,
"source": "Atlanta",
"destination": "Washington",
"distance": 600,
"airlines": "Lufthansa",
"fare": 600
},
{
"key": 5,
"source": "Washington",
"destination": "Atlanta",
"distance": 600,
"airlines": "KLM",
"fare": 400
},
{
"key": 6,
"source": "New York",
"destination": "Atlanta",
"distance": 300,
"airlines": "Qatar",
"fare": 1300
},
{
"key": 7,
"source": "Huston",
"destination": "Atlanta",
"distance": 800,
"airlines": "Indigo",
"fare": 400
},
{
"key": 8,
"source": "Atlanta",
"destination": "Huston",
"distance": 800,
"airlines": "Spicejet",
"fare": 600
},
{
"key": 9,
"source": "New York",
"destination": "Chicago",
"distance": 1000,
"airlines": "Air China",
"fare": 500
},
{
"key": 10,
"source": "Chicago",
"destination": "New York",
"distance": 1000,
"airlines": "Jet Airways",
"fare": 200
},
{
"key": 11,
"source": "Dallas",
"destination": "Chicago",
"distance": 900,
"airlines": "Lufthansa",
"fare": 1300
},
{
"key": 12,
"source": "Austin",
"destination": "Huston",
"distance": 160,
"airlines": "Lufthansa",
"fare": 240
},
{
"key": 13,
"source": "Dallas",
"destination": "New York",
"distance": 780,
"airlines": "Lufthansa",
"fare": 300
}
]
};
var g = {
nodes:[],
edges:[]
}
// Generate a random graph:
colors = [
'#617db4',
'#668f3c',
'#c6583e',
'#b956af'
];
sigma.utils.pkg('sigma.canvas.nodes');
sigma.canvas.nodes.border = function(node, context, settings) {
var prefix = settings('prefix') || '';
context.beginPath();
context.arc(
node[prefix + 'x']+15,
node[prefix + 'y'],
node[prefix + 'size']-2,
0,
Math.PI * 2,
true
);
//context.fillStyle = "orange";
context.strokeStyle = node.color || settings('defaultNodeColor');
//get the data from the group
//var data = d3.select(this).data();
context.stroke();
//context.fill();
context.font = "10px Arial";
context.fillStyle = "black";
context.strokeStyle = "black";
//write the text in the context
context.fillText(10,node[prefix + 'x']+15+ 10, node[prefix + 'size']-2-15);
// Adding a border
//context.lineWidth = node.borderWidth || 1;
//context.strokeStyle = node.borderColor || '#fff';
//context.stroke();
context.fillStyle = node.color || settings('defaultNodeColor');
context.beginPath();
context.arc(
node[prefix + 'x'],
node[prefix + 'y'],
node[prefix + 'size'],
0,
Math.PI * 2,
true
);
context.closePath();
context.fill();
};
for (var i = 0; i < graph.nodes.length; i++)
g.nodes.push({
id: graph.nodes[i]['city'],
label: graph.nodes[i]['city'],
x: Math.random(),
y: Math.random(),
size: 8,
color: colors[Math.floor(Math.random() * colors.length)]
});
for (var i = 0; i < graph.edges.length; i++)
g.edges.push({
id: graph.edges[i]['key'],
source: graph.edges[i]['source'],
target: graph.edges[i]['destination'],
size: 8,
label:graph.edges[i]['airlines'],
color: '#668e3e',
type:'curvedArrow'
});
s = new sigma({
graph: g,
renderer: {
container: document.getElementById('graph-container'),
type: 'canvas'
},
settings: {
edgeLabelSize: 'proportional',
minNodeSize: 1,
maxNodeSize: 10,
minEdgeSize: 0.1,
maxEdgeSize: 2,
enableEdgeHovering: true,
edgeHoverSizeRatio: 2,
defaultNodeType: 'border',
defaultNodeColor:"#fff",
mouseEnabled: true,
touchEnabled: true
}
});
//s.settings('autoRescale', false)
s.startForceAtlas2({worker: true, barnesHutOptimize: false});
s.stopForceAtlas2();
s.bind('rightClickNode', function(e) {
console.log(e.type, e.data.node.label, e.data.captor);
var name = 'New City'+Math.random();
s.graph.addNode({
id: name,
label: 'baai',
x: Math.random(),
y: Math.random(),
size: 8,
color: colors[Math.floor(Math.random() * colors.length)]
});
s.graph.addEdge({
id: name +Math.random(),
source: e.data.node.id,
target: name,
size: 8,
label:'bit'+Math.random(),
color: '#668e3e',
type:'curvedArrow'
});
// Edge with Already existing one
s.graph.addEdge({
id: name+Math.random(),
source: 'Huston',
target: name,
size: 8,
label:'New City'+Math.random(),
color: '#668e3e',
type:'curvedArrow'
});
setTimeout(function(){
s.refresh();
},1000)
});
</script>
</body>
</html>
попытки
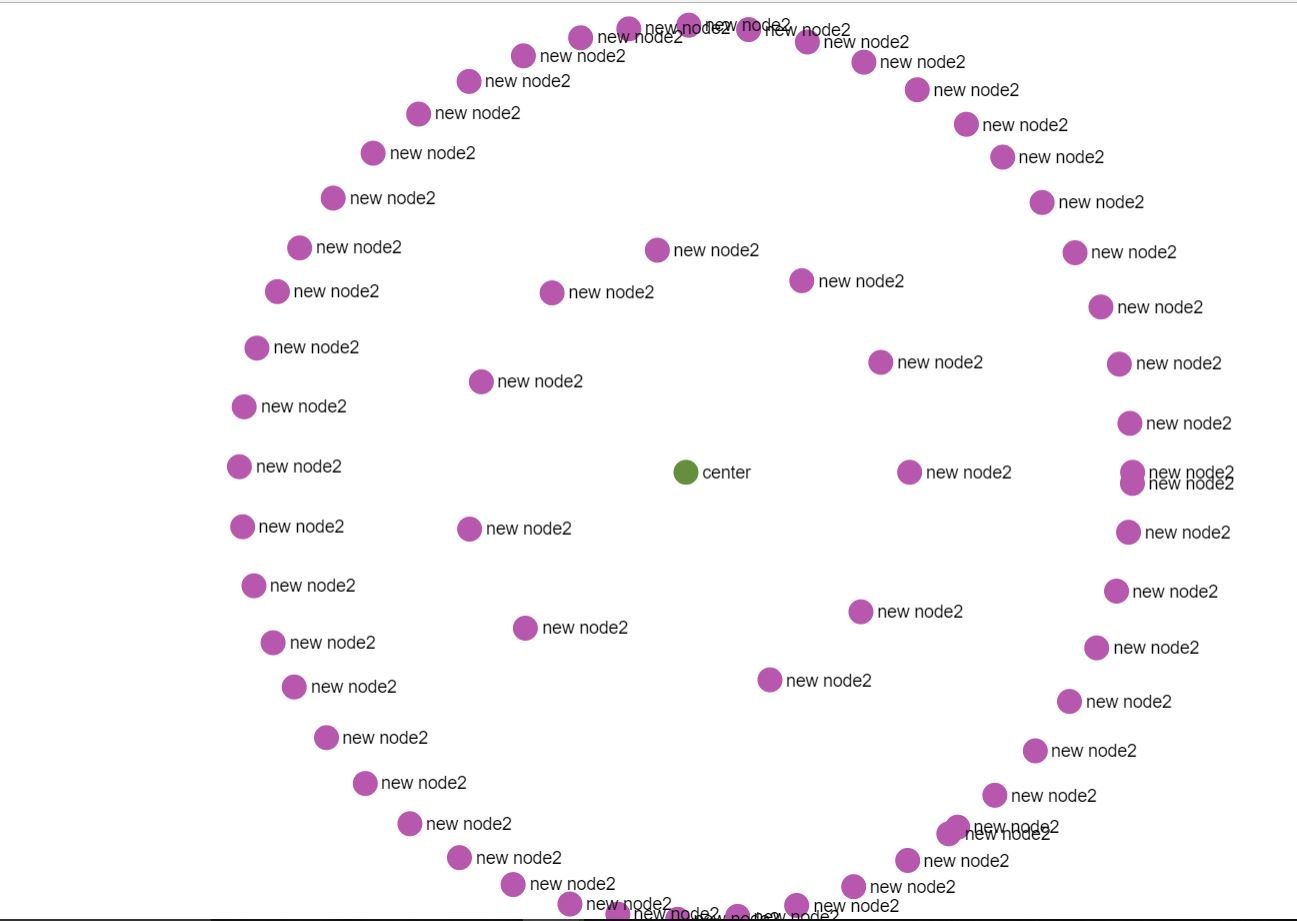
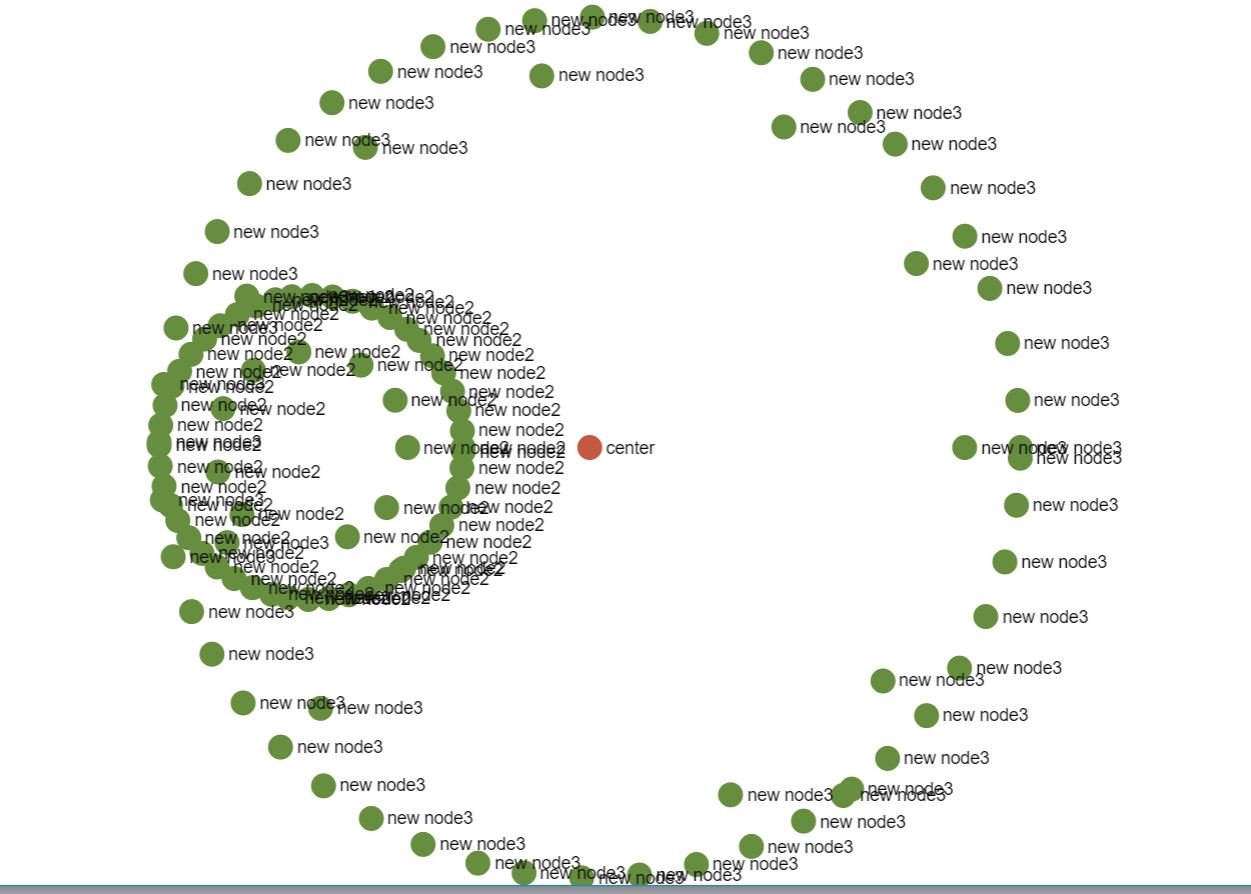
При щелчке узла я размещаю узлы вокруг него, непрерывно увеличивая радиус. В JSFiddle вы можете увидеть это. Первый щелчок прошел хорошо, но при следующем щелчке - один круг внутри другого. Какой радиус я должен поставить, чтобы он не выглядел так (как на скриншоте)?
При втором нажатии он позиционируется относительно и становится таким же, как этот скриншот. Но я хочу фактическое позиционирование вместо относительного.
2 ответа
Схема направленного графа Fruchterman Reingold Force ( сводка алгоритма) представляет силы между узлами в виде пружин, соединяющих стальные кольца, и постоянно пытается найти баланс между всеми узлами.
Он доступен в виде плагина в Linkurious (форк Sigma.js). Этот макет может быть именно то, что вам нужно.
Используя ваш собственный код, и только следующие зависимости:sigma.plugins.animate
sigma.layouts.fruchtermanReingold (от вилки Linkurious)
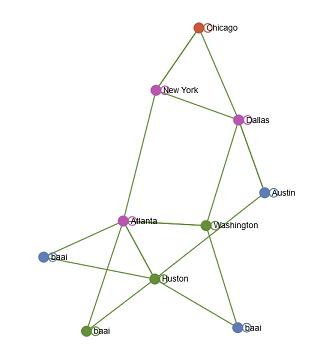
Я получил следующую визуализацию графика:


Чтобы добиться этого, когда вы инициировали макет Force Atlas 2, замените его следующим:
sigma.layouts.fruchtermanReingold.configure(sigmaInstance, {easing: 'quadraticOut'});
sigma.layouts.fruchtermanReingold.start(sigmaInstance);
и, что самое важное, сразу после того, как вы создали новый узел или удалили узел, вам нужно перезапустить макет:
sigmaInstance.refresh();
sigma.layouts.fruchtermanReingold.start(sigmaInstance);
Теперь несколько советов
- Там нет реальной необходимости
setTimeout()чтобы это работало. Просто не забывайте перезапускать силовую раскладку после каждого обновления графика. - Ваш код, кажется, воспроизводит намного более богатую визуализацию, чем то, что показывают ваши скриншоты - с изогнутыми краями, метками и т. Д. Убедитесь, что все зависимости действительно загружены.
- Если вы используете изогнутые ребра, раскладка силы все равно будет работать правильно, но представление может быть немного странным, поэтому не используйте его.
- Компоновка Fruchterman-Reingold может быть сконфигурирована с учетом произвольной длительности, силы тяжести, методов ослабления и т. Д. Прочитайте документацию, чтобы достичь полной мощности.
Вместо использования позиции Math.randomустановите положение так, чтобы оно было близко к узлу, по которому щелкнули, и позвольте силовому макету позаботиться о его перемещении в правильное положение. Итак, вы должны изменить это:
s.graph.addNode({
    x: Math.random(),
    y: Math.random(),
к этому:
s.graph.addNode({
    x: clickedNode.x + 2* Math.random() - 1,
    y: clickedNode.y + 2* Math.random() - 1,

