Как построить матрицу путаницы с осью строки, а не целое число в Python
Я следую предыдущей теме о том, как построить матрицу путаницы в Matplotlib. Сценарий выглядит следующим образом:
from numpy import *
import matplotlib.pyplot as plt
from pylab import *

conf_arr = [[33,2,0,0,0,0,0,0,0,1,3], [3,31,0,0,0,0,0,0,0,0,0], [0,4,41,0,0,0,0,0,0,0,1], [0,1,0,30,0,6,0,0,0,0,1], [0,0,0,0,38,10,0,0,0,0,0], [0,0,0,3,1,39,0,0,0,0,4], [0,2,2,0,4,1,31,0,0,0,2], [0,1,0,0,0,0,0,36,0,2,0], [0,0,0,0,0,0,1,5,37,5,1], [3,0,0,0,0,0,0,0,0,39,0], [0,0,0,0,0,0,0,0,0,0,38] ]

norm_conf = []
for i in conf_arr:
        a = 0
        tmp_arr = []
        a = sum(i,0)
        for j in i:
                tmp_arr.append(float(j)/float(a))
        norm_conf.append(tmp_arr)

plt.clf()
fig = plt.figure()
ax = fig.add_subplot(111)
res = ax.imshow(array(norm_conf), cmap=cm.jet, interpolation='nearest')


for i,j in ((x,y) for x in xrange(len(conf_arr))
            for y in xrange(len(conf_arr[0]))):
    ax.annotate(str(conf_arr[i][j]),xy=(i,j))

cb = fig.colorbar(res)
savefig("confusion_matrix.png", format="png")
Я хотел бы изменить ось, чтобы показать строку букв, скажем (A, B, C,...), а не целые числа (0,1,2,3, ..10). Как можно это сделать? Благодарю.
Musa
8 ответов
Вот что я предполагаю, что вы хотите:
import numpy as np
import matplotlib.pyplot as plt

conf_arr = [[33,2,0,0,0,0,0,0,0,1,3],
            [3,31,0,0,0,0,0,0,0,0,0],
            [0,4,41,0,0,0,0,0,0,0,1],
            [0,1,0,30,0,6,0,0,0,0,1],
            [0,0,0,0,38,10,0,0,0,0,0],
            [0,0,0,3,1,39,0,0,0,0,4],
            [0,2,2,0,4,1,31,0,0,0,2],
            [0,1,0,0,0,0,0,36,0,2,0],
            [0,0,0,0,0,0,1,5,37,5,1],
            [3,0,0,0,0,0,0,0,0,39,0],
            [0,0,0,0,0,0,0,0,0,0,38]]

norm_conf = []
for i in conf_arr:
    a = 0
    tmp_arr = []
    a = sum(i, 0)
    for j in i:
        tmp_arr.append(float(j)/float(a))
    norm_conf.append(tmp_arr)

fig = plt.figure()
plt.clf()
ax = fig.add_subplot(111)
ax.set_aspect(1)
res = ax.imshow(np.array(norm_conf), cmap=plt.cm.jet,
                interpolation='nearest')

width, height = conf_arr.shape

for x in xrange(width):
    for y in xrange(height):
        ax.annotate(str(conf_arr[x][y]), xy=(y, x),
                    horizontalalignment='center',
                    verticalalignment='center')

cb = fig.colorbar(res)
alphabet = 'ABCDEFGHIJKLMNOPQRSTUVWXYZ'
plt.xticks(range(width), alphabet[:width])
plt.yticks(range(height), alphabet[:height])
plt.savefig('confusion_matrix.png', format='png')
Вот что вы хотите:
from string import ascii_uppercase
from pandas import DataFrame
import numpy as np
import seaborn as sn
from sklearn.metrics import confusion_matrix

y_test = np.array([1,2,3,4,5, 1,2,3,4,5, 1,2,3,4,5])
predic = np.array([1,2,4,3,5, 1,2,4,3,5, 1,2,3,4,4])

columns = ['class %s' %(i) for i in list(ascii_uppercase)[0:len(np.unique(y_test))]]

confm = confusion_matrix(y_test, predic)
df_cm = DataFrame(confm, index=columns, columns=columns)

ax = sn.heatmap(df_cm, cmap='Oranges', annot=True)
Пример вывода изображения здесь: 
Если вам нужна более полная матрица путаницы в качестве значения по умолчанию для matlab, с итогами (последняя строка и последний столбец) и процентами в каждой ячейке, см. Этот модуль ниже.
Потому что я искал в интернете и не нашел такой путаницы, как эта, на python, и я разработал одну с этими улучшениями и поделился ею на git.
REF:
https://github.com/wcipriano/pretty-print-confusion-matrix
Пример вывода здесь: 
Просто используйте matplotlib.pyplot.xticks а также matplotlib.pyplot.yticks,
Например
import matplotlib.pyplot as plt
import numpy as np

plt.imshow(np.random.random((5,5)), interpolation='nearest')
plt.xticks(np.arange(0,5), ['A', 'B', 'C', 'D', 'E'])
plt.yticks(np.arange(0,5), ['F', 'G', 'H', 'I', 'J'])

plt.show()

Чтобы получить график, который выглядит так, как будто sklearn создает для вас, просто используйте их код!
      from sklearn.metrics import confusion_matrix
# I use the sklearn metric source for this one
from sklearn.metrics import ConfusionMatrixDisplay
classNames = np.arange(1,6)
# Convert to discrete values for confusion matrix
regPredictionsCut = pd.cut(regPredictionsTDF[0], bins=5, labels=classNames, right=False)
cm = confusion_matrix(y_test, regPredictionsCut)
disp = ConfusionMatrixDisplay(confusion_matrix=cm,display_labels=classNames)
disp.plot()
Я понял это, перейдя на https://scikit-learn.org/stable/modules/generated/sklearn.metrics.plot_confusion_matrix.html и щелкнув ссылку «источник».
Вот итоговый график:

Если ваши результаты хранятся в CSV-файле, вы можете использовать этот метод напрямую, в противном случае вам может потребоваться внести некоторые изменения в соответствии со структурой ваших результатов.
Пример модификации с сайта sklearn:
import itertools
import numpy as np
import matplotlib.pyplot as plt
from sklearn.metrics import confusion_matrix

def plot_confusion_matrix(cm, classes,
                          normalize=False,
                          title='Confusion matrix',
                          cmap=plt.cm.Blues):
    """
    This function prints and plots the confusion matrix.
    Normalization can be applied by setting `normalize=True`.
    """
    if normalize:
        cm = cm.astype('float') / cm.sum(axis=1)[:, np.newaxis]
        print("Normalized confusion matrix")
    else:
        print('Confusion matrix, without normalization')

    print(cm)

    plt.imshow(cm, interpolation='nearest', cmap=cmap)
    plt.title(title)
    plt.colorbar()
    tick_marks = np.arange(len(classes))
    plt.xticks(tick_marks, classes, rotation=45)
    plt.yticks(tick_marks, classes)

    fmt = '.2f' if normalize else 'd'
    thresh = cm.max() / 2.
    for i, j in itertools.product(range(cm.shape[0]), range(cm.shape[1])):
        plt.text(j, i, format(cm[i, j], fmt),
                 horizontalalignment="center",
                 color="white" if cm[i, j] > thresh else "black")

    plt.ylabel('True label')
    plt.xlabel('Predicted label')
    plt.tight_layout()


#Assumming that your predicted results are in csv. If not, you can still modify the example to suit your requirements
df = pd.read_csv("dataframe.csv", index_col=0)

cnf_matrix = confusion_matrix(df["actual_class_num"], df["predicted_class_num"])

#getting the unique class text based on actual numerically represented classes
unique_class_df = df.drop_duplicates(['actual_class_num','actual_class_text']).sort_values("actual_class_num")

# Plot non-normalized confusion matrix
plt.figure()
plot_confusion_matrix(cnf_matrix, classes=unique_class_df["actual_class_text"],
                      title='Confusion matrix, without normalization')
Вывод будет выглядеть примерно так:
https://stackru.co m/images/94b98393bd10a2fd90ce6bb11843fdc747e07b98.png
Лично я предпочитаю mlxtend со sklearn:
      from mlxtend.plotting import plot_confusion_matrix
from sklearn.metrics import confusion_matrix

plot_confusion_matrix(confusion_matrix(y_true, y_pred))
Мы можем использовать встроенную функцию sklearn следующим образом:
      >>> import matplotlib.pyplot as plt
>>> from sklearn.datasets import make_classification
>>> from sklearn.metrics import plot_confusion_matrix
>>> from sklearn.model_selection import train_test_split
>>> from sklearn.svm import SVC
>>> X, y = make_classification(random_state=0)
>>> X_train, X_test, y_train, y_test = train_test_split(
...         X, y, random_state=0)
>>> clf = SVC(random_state=0)
>>> clf.fit(X_train, y_train)
SVC(random_state=0)
>>> plot_confusion_matrix(clf, X_test, y_test)
>>> plt.show()

Код и изображение взяты отсюда .
Вот еще один пример чистого Matplotlib:
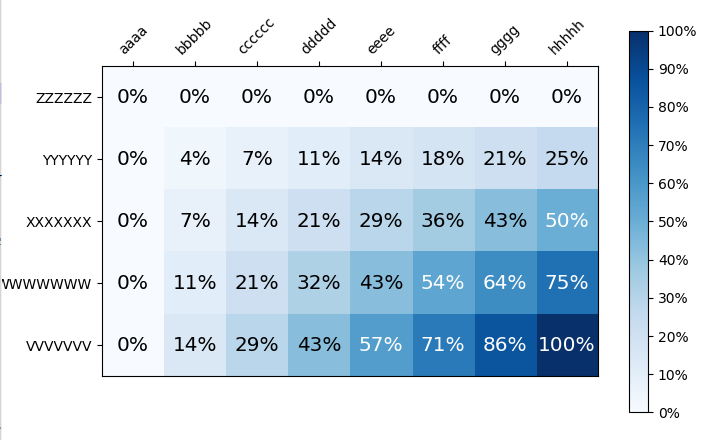
Код Python — служебная функцияconf_matrix_creatorи пример функцииconf_matrix_exampleкоторый использует первый:
      import matplotlib.pyplot as plt
import numpy as np

def conf_matrix_creator(mat, settings):
    colormap = settings['colormap'] if 'colormap' in settings else None
    figsize = settings['figsize'] if 'figsize' in settings else None
    plt.figure(figsize = figsize)
    plt.imshow(mat, cmap =  colormap)

    view_colorbar = settings['colorbar']['view'] if 'colorbar' in settings else True
    if view_colorbar:
        ticks = np.arange(*settings['colorbar']['arange']) if 'colorbar' in settings and 'arange' in settings['colorbar'] else None
        cbar = plt.colorbar(ticks = ticks)
        if 'colorbar' in settings and 'text_formatter' in settings['colorbar']:
            cbar.ax.set_yticklabels([settings['colorbar']['text_formatter'](v) for v in ticks])
    if 'cell_text' in settings:
        for x in range(mat.shape[1]):
            for y in range(mat.shape[0]):
                text_color = settings['cell_text']['color_function'](mat[y,x]) if 'color_function' in settings['cell_text'] else 'black'
                va = settings['cell_text']['vertical_alignment'] if 'vertical_alignment' in settings['cell_text'] else 'center'
                ha = settings['cell_text']['horizontal_alignment'] if 'horizontal_alignment' in settings['cell_text'] else 'center'
                size = settings['cell_text']['size'] if 'size' in settings['cell_text'] else 'x-large'
                text = settings['cell_text']['text_formatter'](mat[y,x]) if 'text_formatter' in settings['cell_text'] else str(mat[y,x])
                plt.text(x, y, text, va = va, ha = ha, size = size, color = text_color)
    axes = plt.axes()
    if 'xticklabels' in settings:
        if 'labels' in settings['xticklabels']:
            labels = settings['xticklabels']['labels']
            axes.set_xticks(range(len(labels)))
            axes.set_xticklabels(labels)
        if 'location' in settings['xticklabels']:
            location = settings['xticklabels']['location']
            # By default it will be at the bottom, so only regarding case of top location
            if location == 'top':
                axes.xaxis.tick_top()
        if 'rotation' in settings['xticklabels']:
            rotation = settings['xticklabels']['rotation']
            plt.xticks(rotation = rotation)
    if 'yticklabels' in settings:
        if 'labels' in settings['yticklabels']:
            labels = settings['yticklabels']['labels']
            axes.set_yticks(range(len(labels)))
            axes.set_yticklabels(labels)
        if 'location' in settings['yticklabels']:
            location = settings['yticklabels']['location']
            # By default it will be at the left, so only regarding case of right location
            if location == 'right':
                axes.yaxis.tick_right()
        if 'rotation' in settings['yticklabels']:
            rotation = settings['yticklabels']['rotation']
            plt.yticks(rotation = rotation)
    plt.show()
Использование:
      def conf_matrix_example():
    mat = np.zeros((5,8))
    for y in range(mat.shape[0]):
        for x in range(mat.shape[1]):
            mat[y,x] = y * x / float((mat.shape[0] - 1) * (mat.shape[1] - 1))


    settings = {
        'figsize' : (8,5),
        'colormap' : 'Blues',
        'colorbar' : {
            'view' : True,
            'arange' : (0, 1.001, 0.1),
            'text_formatter' : lambda tick_value : '{0:.0f}%'.format(tick_value*100),
        },
        'xticklabels' : {
            'labels' : ['aaaa', 'bbbbb', 'cccccc', 'ddddd', 'eeee', 'ffff', 'gggg', 'hhhhh'],
            'location' : 'top',
            'rotation' : 45,
        },
        'yticklabels' : {
            'labels' : ['ZZZZZZ', 'YYYYYY', 'XXXXXXX', 'WWWWWWW', 'VVVVVVV'],
        },
        'cell_text' : {
            'vertical_alignment' : 'center',
            'horizontal_alignment' : 'center',
            'size' : 'x-large',
            'color_function' : lambda cell_value : 'black' if cell_value < 0.5 else 'white',
            'text_formatter' : lambda cell_value : '{0:.0f}%'.format(cell_value*100),
        },
    }

    conf_matrix_creator(mat, settings)