Как сделать одинаковый масштаб, лимит и отметку 2 yaxis влево и вправо на графике Matlab
Ниже приведен код, который я использовал, чтобы иметь одинаковый масштаб для обеих осей Y на графике MATLAB:
%% Additions by Dev-iL:
date = 1:10;
z = 4*randn(3,10);
spread = 0.2*sum(z,1);
figure();
%% Original code by RSerrano:
ax(2) = subplot(2,1,2);
% z = horzcat(zscore,signal1,signal2); % Dev-iL
  yyaxis left
  plot(date,z,'LineWidth',0.5);
  ylabel('Z-score(residuals)');
  set(ax(2),'YColor',[0 0 0],'YDir','normal');
  ax(2).YLimMode = 'manual';
  ax(2).YLim = [-8 8];
  ax(2).YTickMode = 'manual';
  ax(2).YTick = -8:2:8;

co1 = get(gca,'ColorOrder');
% Change to new colors.
set(gca, 'ColorOrder', [0.83 0.82 0.78; 0 0.5 0; 0.47 0.67 0.19],...
         'NextPlot', 'replacechildren');
co1 = get(gca,'ColorOrder');
plot(date,z,'LineWidth',0.3);

z2 = spread;
yyaxis right
plot(date,z2,'Color',[0.31 0.31 0.31], 'LineWidth',0.5);
xlabel('Date');
ylabel('Spread(USD)');
title(['Spread and Trade Signals']);
legend('Z-score','Signal1', ...
'Signal2','Spread', ...
'Location','NE');
set(ax(2),'YColor',[0 0 0],'YDir','normal');

ax(2).YTick = -8:2:8;
axis tight
grid on
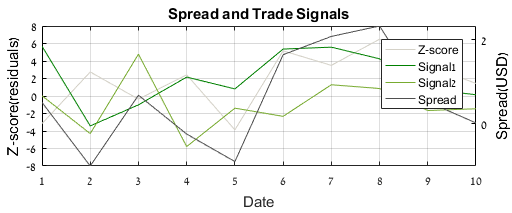
Это приводит к:
Как я могу сделать ylim а также ytick левой оси Y то же самое с правой оси Y? или как я могу применить ylim а также ytick левой оси у правой оси у?
1 ответ
Судя по yyaxis вы используете, я предполагаю, что у вас есть R2016a и, следовательно, с использованием HG2.
В качестве альтернативы yyaxis Предполагая, что вы просто хотите иметь одинаковые отметки с обеих сторон, вы можете просто скопировать оси и установить положение оси y справа (как показано в аналогичной задаче здесь):
hR = axes('ylim', [y(1) y(end)],'XTick', [], 'YTick', y,'YAxisLocation', 'right',...
            'XTickLabel',[]);
Используя немного перестроенную версию вашего кода:
%% Definitions:
date = 1:10;
z = 4*randn(3,10);
z2 = 0.2*sum(z,1);
y = -8:2:8;
%% Create the figure:
figure(); hL = gca;
set(hL, 'ColorOrder', [0.83 0.82 0.78; 0 0.5 0; 0.47 0.67 0.19],...
        'NextPlot', 'replacechildren');
plot(date, z,'LineWidth',0.5); hold on;
plot(date, z2,'Color',[0.31 0.31 0.31], 'LineWidth',0.5);
%% Customize plots:
grid on
xlabel(hL,'Date');
ylabel(hL,'Z-score(residuals)');
hL.YLimMode = 'manual';
hL.YLim = [y(1) y(end)];
hL.YTickMode = 'manual';
hL.YTick = y;

title(['Spread and Trade Signals']);
legend(hL,'Z-score','Signal1', ...
'Signal2','Spread', ...
'Location','NE');

hR = axes('ylim', [y(1) y(end)],'XTick', [], 'YTick', y,'YAxisLocation', 'right',...
            'XTickLabel',[],'Color','none');
ylabel(hR,'Spread(USD)');
linkaxes([hL,hR],'xy'); % To sync zooming, panning etc.
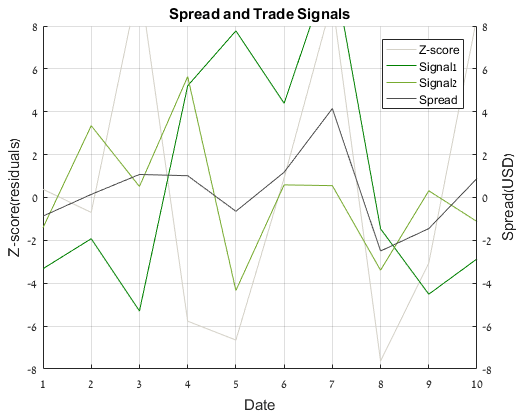
Вот результат:
Использовать с subplot:
Здесь вместо создания новых осей используется axes нам может понадобиться создать их с помощью copyobj вместо этого (это происходит потому, что axes случилась команда создать новые оси в правильных Position по умолчанию Position для осей; в subplot Position не по умолчанию, поэтому предыдущий трюк не работает):
%% Definitions:
date = 1:10;
z = 4*randn(3,10);
z2 = 0.2*sum(z,1);
y = -8:2:8;
%% Create the figure:
figure(); subplot(2,1,2); hL = gca;
set(hL, 'ColorOrder', [0.83 0.82 0.78; 0 0.5 0; 0.47 0.67 0.19], 'NextPlot', 'replacechildren');
plot(date, z,'LineWidth',0.5); hold on;
plot(date, z2,'Color',[0.31 0.31 0.31], 'LineWidth',0.5);
%% Customize plots:
grid on
xlabel(hL,'Date');
ylabel(hL,'Z-score(residuals)');
hL.YLimMode = 'manual';
hL.YLim = [y(1) y(end)];
hL.YTickMode = 'manual';
hL.YTick = y;

hR = copyobj(hL,gcf);
hR.YAxisLocation = 'right';

title(['Spread and Trade Signals']);
legend(hL,'Z-score','Signal1', ...
'Signal2','Spread', ...
'Location','NE');

ylabel(hR,'Spread(USD)');
linkaxes([hL,hR],'xy'); % To sync zooming, panning etc.

