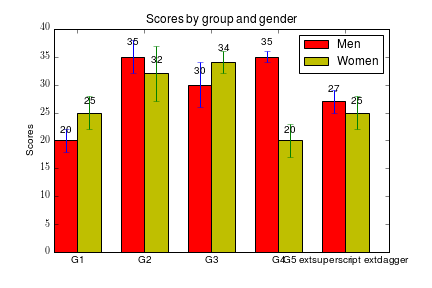
matplotlib: добавить специальный математический символ в xticklabels
Я следую примеру кода здесь, чтобы получить гистограмму. Я просто хочу добавить верхний индекс \ textdagger(†) к последнему названию группы "G5". Вот что я пробовал (проверьте строку ax.set_xticklabels):
import numpy as np
import matplotlib
import matplotlib.pyplot as plt

N = 5
men_means = (20, 35, 30, 35, 27)
men_std = (2, 3, 4, 1, 2)

ind = np.arange(N)  # the x locations for the groups
width = 0.35       # the width of the bars
matplotlib.rc('text', usetex = True)
fig, ax = plt.subplots()
rects1 = ax.bar(ind, men_means, width, color='r', yerr=men_std)

women_means = (25, 32, 34, 20, 25)
women_std = (3, 5, 2, 3, 3)
rects2 = ax.bar(ind + width, women_means, width, color='y', yerr=women_std)

# add some text for labels, title and axes ticks
ax.set_ylabel('Scores')
ax.set_title('Scores by group and gender')
ax.set_xticks(ind + width)
ax.set_xticklabels(('G1', 'G2', 'G3', 'G4', 'G5\textsuperscript{\textdagger}'))

ax.legend((rects1[0], rects2[0]), ('Men', 'Women'))

def autolabel(rects):
    """
    Attach a text label above each bar displaying its height
    """
    for rect in rects:
        height = rect.get_height()
        ax.text(rect.get_x() + rect.get_width()/2., 1.05*height,
                '%d' % int(height),
                ha='center', va='bottom')

autolabel(rects1)
autolabel(rects2)

plt.show()
Как я могу получить правильный верхний индекс † для "G5" тогда?
1 ответ
Решение
Многие команды tex могут быть использованы внутри matplotlib без необходимости использования самого tex; это называется MathText. Как и команды tex, вы должны заключить команду MathText в два знака доллара.
'G5$^\dagger$'
Теперь, даже если вы используете текс (plt.rc('text', usetex = True)) команда остается прежней:
'G5$^\dagger$'
