Как преобразовать пространственную точку dataframe в многоугольник и пространственный многоугольник
Мне не удалось преобразовать пространственную точку данных в полигон, а затем в пространственный полигон после нескольких дней пробного онлайн-поиска.
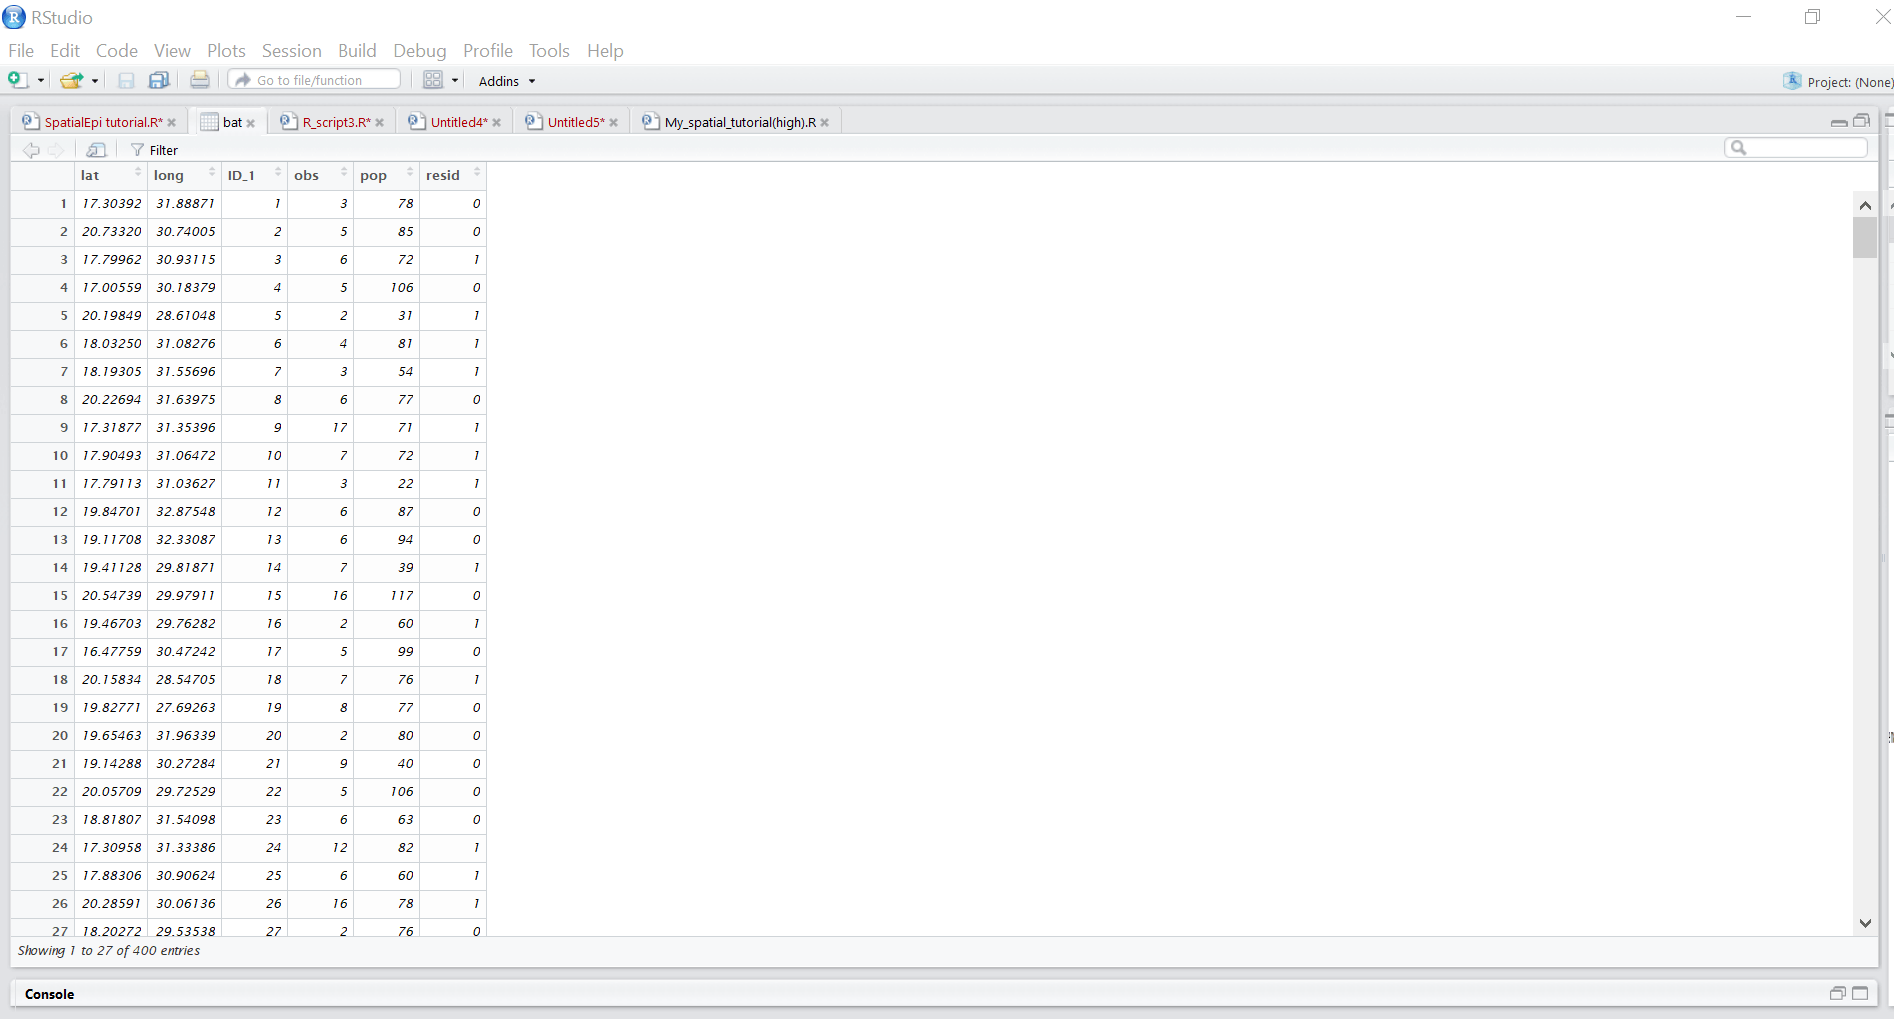
Данные (типичные географические данные DHS) насчитывают 400 кластеров. Вот URL-адрес страницы данных:
Мне нужно создать этот многоугольник и пространственный многоугольник, чтобы создать sp.object в пакете SpatialEpi r, чтобы запустить программу "Bayes_cluster". Как реализовать оценку уровня кластеров (для Zimbabwe Admin_level 1) для кластеров? Моя цель - оценить значимые точки распространения ВИЧ-инфекции на уровне отдельных кластеров и провинций.
Мой код:
library(sp)
library(SpatialEpi)
library(spatstat)
library(rgdal)
library(maptools)
library(Matrix)
library(spdep)
library(raster)

dat<- read.csv("hiv_data_R.csv")
summary(dat)
population<-dat$pop
cases<-dat$obs
#Estimate expected number of cases
exp<-expected(dat$pop, dat$obs, 1)
dat$exp<-exp

#To convert latlong to centroid
dat<- read.csv("hiv_data_R1.csv")
centroids <- latlong2grid(dat[,1:2])

#To convert ZWGE72FL.shp to polygon and then spatial polygon
#ZWGE72FL is the shape file that comes with the Zimbabwe DHS data
#with coordinates for 400clusters in the data frame(hiv_data_R1)

Zmb_shp<-readOGR(dsn=".", layer="ZWGE72FL")
coordinate.system <-'+proj=latlong'
poly<-polygon(Zmb_shp)
spa_poly<-polygon2spatial_polygon(poly, coordinate.system, dat$ID_1)

#To convert ZWE_adm1 polygon then spatial polygon
#ZWE_adm1 is the adminstrative level 1 for the 10 regions in Zimbabwe
Zim_map<-readOGR(dsn=".", layer="ZWE_adm1")
coordinate.system <-'+proj=latlong'
poly<-polygon(Zim_map)
sp_poly<-polygon2spatial_polygon(poly, coordinate.system, dat$ID_1)

#Goal: My goal is to generate the spatial polygon of both shape files
#then use either of the two as "sp.object" in Bayes_clusters as defined bel


## Set parameters
y <- dat$obs
E <- dat$exp
population<-dat$pop
max.prop <- 0.15
shape <- c(2976.3, 2.31)
rate <- c(2977.3, 1.31)
J <- 7
pi0 <- 0.95
n.sim.lambda <- 10^4
n.sim.prior <- 10^5
n.sim.post <- 10^5
centroids <- latlong2grid(dat[,1:2])
sp.obj<- Zim_map/Zim_shp


#Implent Bayes_cluster
output <- bayes_cluster(y, E, population, sp.obj, centroids, max.prop,
               shape, rate, J, pi0, n.sim.lambda, n.sim.prior,  n.sim.post)
